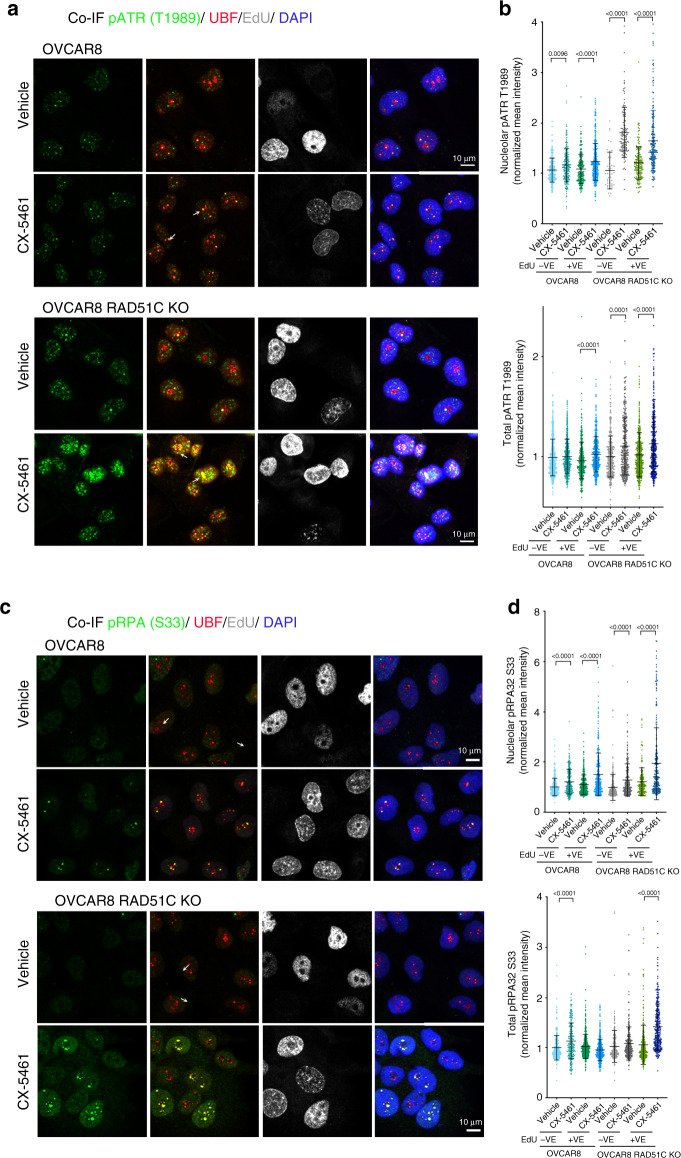
Fig. 5. CX-5461 activates DDR.
a Co-IF analysis of pATR (T1989) and UBF in cells labelled with EdU and treated with vehicle or 1 μM CX-5461 for 3 h. Representative images of three biologically independent experiments. b Quantitation of signal intensity of pATR/UBF colocalized regions and total pATR was performed using CellProfiler and normalized to the median of vehicle treated controls. n = 464 EdU positive cells and n = 250 EdU negative cells per treatment condition examined over three biologically independent experiments. Error bars represent mean ± SD. Statistical analysis was performed using a two-sided one-way ANOVA, Kruskal–wallis multiple comparisons test (adjusted p-values are shown). c Co-IF analysis of pRPA32 (S33) and UBF in cells labelled with EdU and treated with vehicle or 1 μM CX-5461 for 3 h. Representative images of three biologically independent experiments. d Quantitation of signal intensity of pRPA/UBF colocalized regions and total pRPA was performed using CellProfiler and normalized to the median of vehicle treated controls. n = 216 EdU positive and n = 270 EdU negative cells per treatment condition examined over three independent experiments. Error bars represent mean ± SD. Statistical analysis was performed using a one-sided one-way ANOVA, Kruskal–wallis multiple comparisons test (adjusted p-values are shown).

