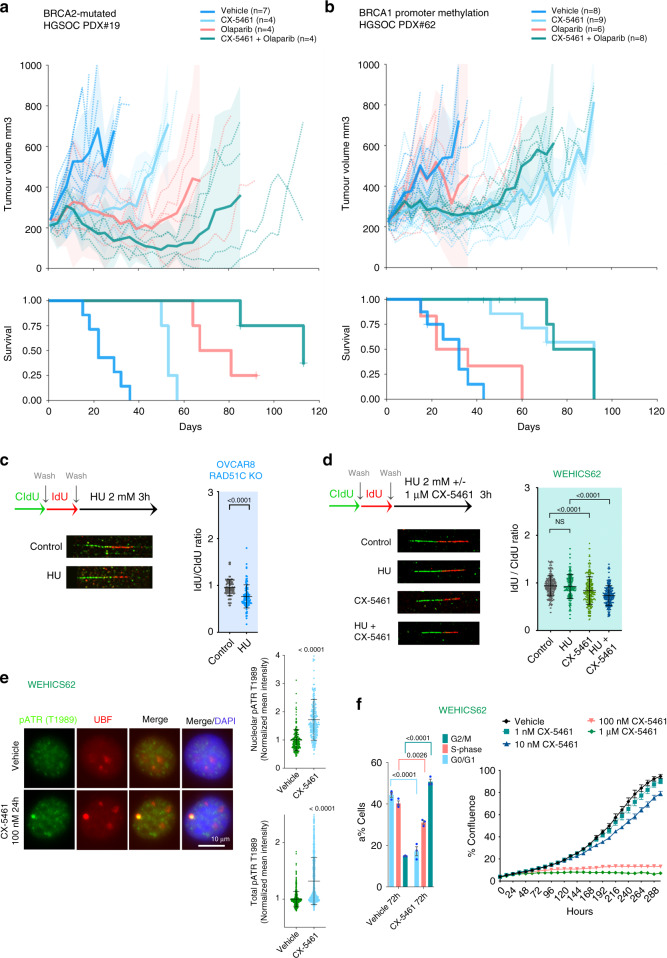
Fig. 9. CX-5461 has significant therapeutic efficacy in HGSOC- patient-derived xenografts (PDX) models.
a Responses observed in post-platinum treated BRCA2-mutant PDX#19 HGSOC-PDX and b PDX #62 with BRCA1 promoter methylation to CX-5461 and olaparib treatment in vivo. Recipient mice bearing the PDX were randomized to treatment with vehicle, 40 mg/kg CX-5461 twice a week, 50 mg/kg olaparib once daily or CX-5461/olaparib combination for 3 weeks. The PDX were harvested at a tumour volume of 700 mm3. Mean tumour volume (mm3) (solid lines) ±95% CI (shaded region) and tumour volume of all individual mice (hashed lines) and corresponding Kaplan-Meier survival analysis. Censored events are represented by crosses on Kaplan-Meier plot. n indicates individual mice. c Schematic of CIdU and IdU pulse-labelling (top). OVCAR8 RAD51C KO cells or d WEHICS62 cell line derived from PDX#6229 were sequentially labelled and either processed or treated with 2 mM hydroxyurea (HU) ± 1 μM CX-5461 for 3 h . Fibres were processed for DNA fibre analysis. n = 102 replication tracks of OVCAR8 RAD51C KO cells analyzed over two independent experiments, n = 236 replication tracks of WEHICS62 cells analysed over three independent experiments. Error bars represent mean ± SD. Statistical analysis in (C) was performed using a two-sided Mann–Whitney test and in (d) using two-sided one-way ANOVA, Tukey’s multiple comparisons test (adjusted p-values are shown). NS denotes non-significant p-value. e Co-IF analysis of pATR (T1989) and UBF in in WEHICS62 cells treated with vehicle or 100 nM CX-5461 for 24 h. Quantitation of signal intensity of the colocalized regions and total pATR was performed using CellProfiler. n = 506 cells per condition analysed over three independent experiments, error bars represent mean ± SD. Statistical analysis was performed using Mann–Whitney test. f BrdU cell cycle analysis of WEHCS62 cells treated with vehicle or 1 μM CX-5461 for 72 h (left panel), n = 3 biological replicates, mean ± SEM. Flow cytometry gating strategy is shown in Supplementary Fig. 3D. Statistical analysis was performed using a two-sided one-way ANOVA, Tukey’s multiple comparisons test (adjusted p-values are shown). In vitro CX-5461 dose response proliferation time-course assessed using IncuCyte ZOOM. Representative of n = 3 biological replicates, mean ± SEM of five technical replicates.

