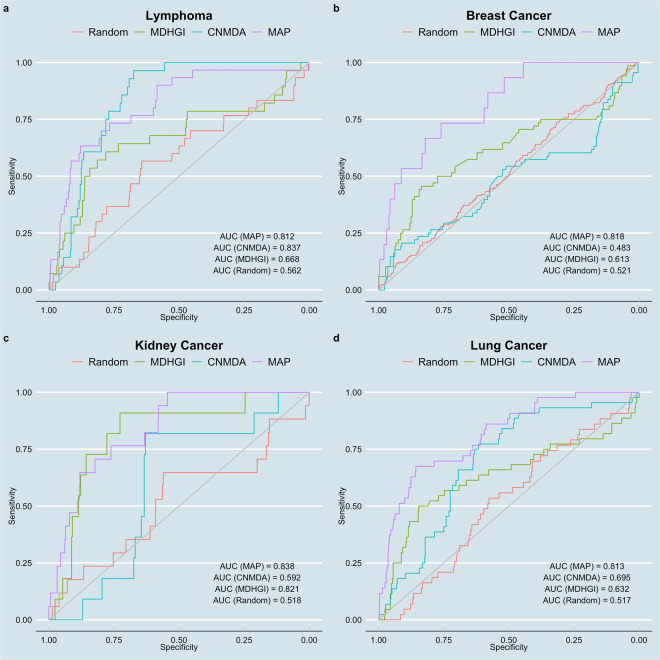
Figure 2.
MAP’s performance in predicting miRNA disease associations for four cancers, evaluated using experimental miRNA-disease associations from the dbDEMC database. For each cancer, four ROC curves are shown: (1) MAP, (2) CNMDA, a current state of the art method for miRNA-disease association prediction, (3) MDHGI, another current method for miRNA-disease association prediction, and (4) a randomized network generated from node label shuffling, as a negative control.

