. 2020 May 20;45(2):95–104. doi: 10.1584/jpestics.D20-001

Fig. 1. Growth-dependent expression of BES1/BZR1 family members was examined using qRT-PCR. In the graphs, data are shown as relative values of the means with standard error (SE) (set 1 for 1-wk-old), following normalization by that of EF1aA4. Statistical analyses were conducted using Tukey’s test (p<0.05).
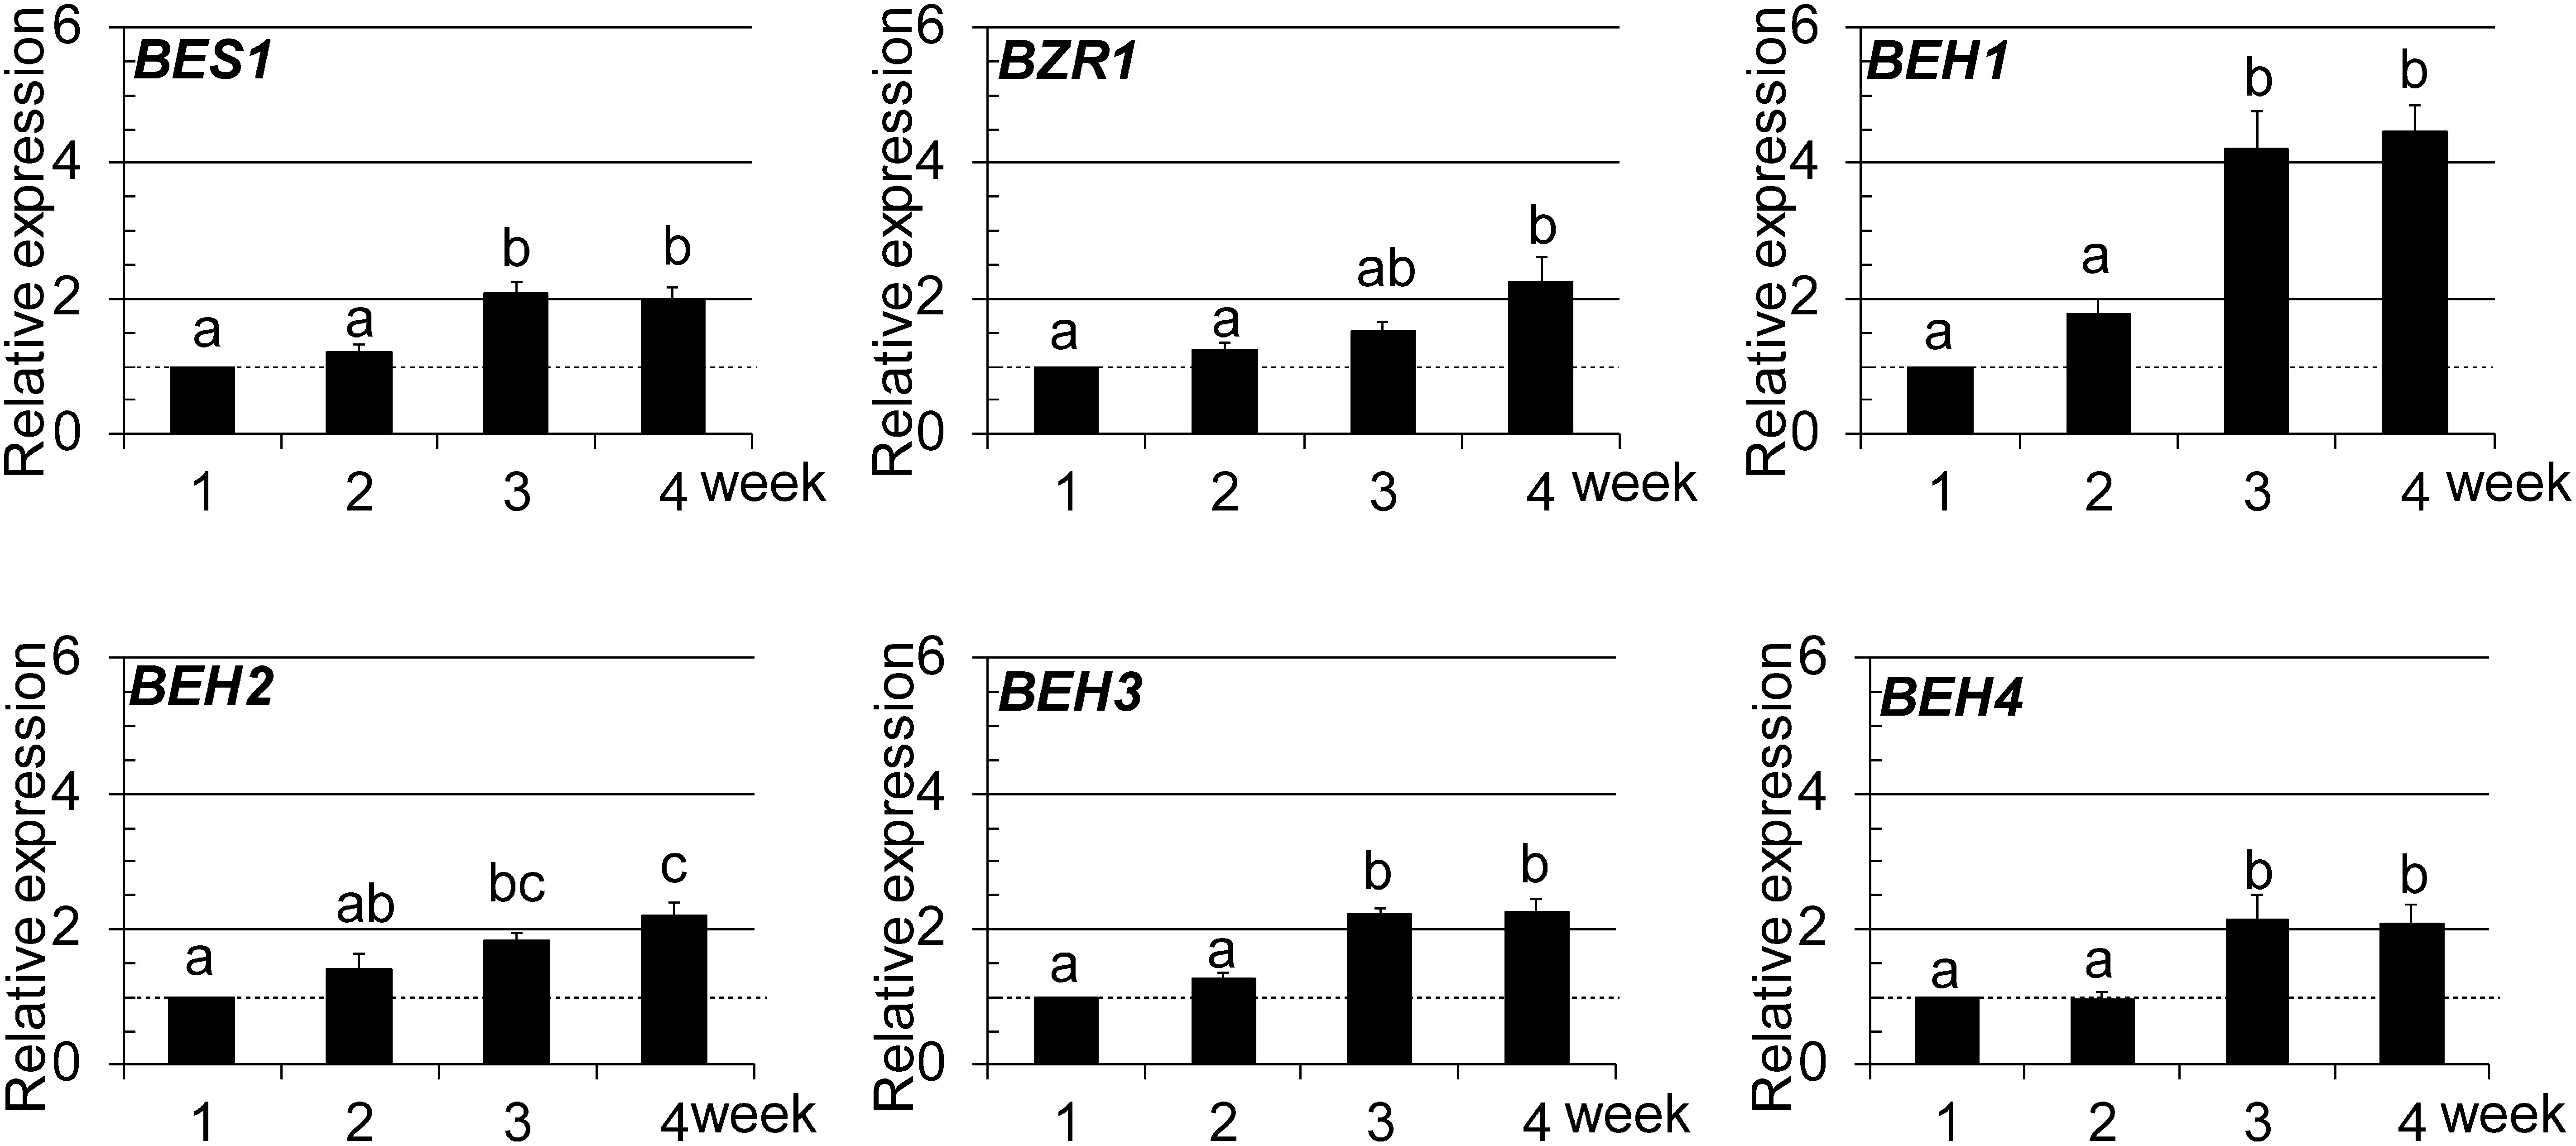
Fig. 1. Growth-dependent expression of BES1/BZR1 family members was examined using qRT-PCR. In the graphs, data are shown as relative values of the means with standard error (SE) (set 1 for 1-wk-old), following normalization by that of EF1aA4. Statistical analyses were conducted using Tukey’s test (p<0.05).