. 2020 May 20;45(2):95–104. doi: 10.1584/jpestics.D20-001

Fig. 4. qRT-PCR was used to evaluate the time-dependent response of BEH1 and BEH2 to an increased or decreased BR level in 2-wk-old seedlings. (A) Brassinolide (BL, 0.1 µM) was given to plants for the indicated number of hours following 2 days’ pretreatment with 5 µM brassinazole (Brz), a BR biosynthesis inhibitor. (B) Brz (5 µM) was applied directly to the seedlings for the indicated number of days. In the graphs, data are shown as relative values of the means with SE (set 1 for time 0), following normalization by that of ACT2. Statistical analyses were performed with Student’s t-test (*p<0.05, **p<0.01).
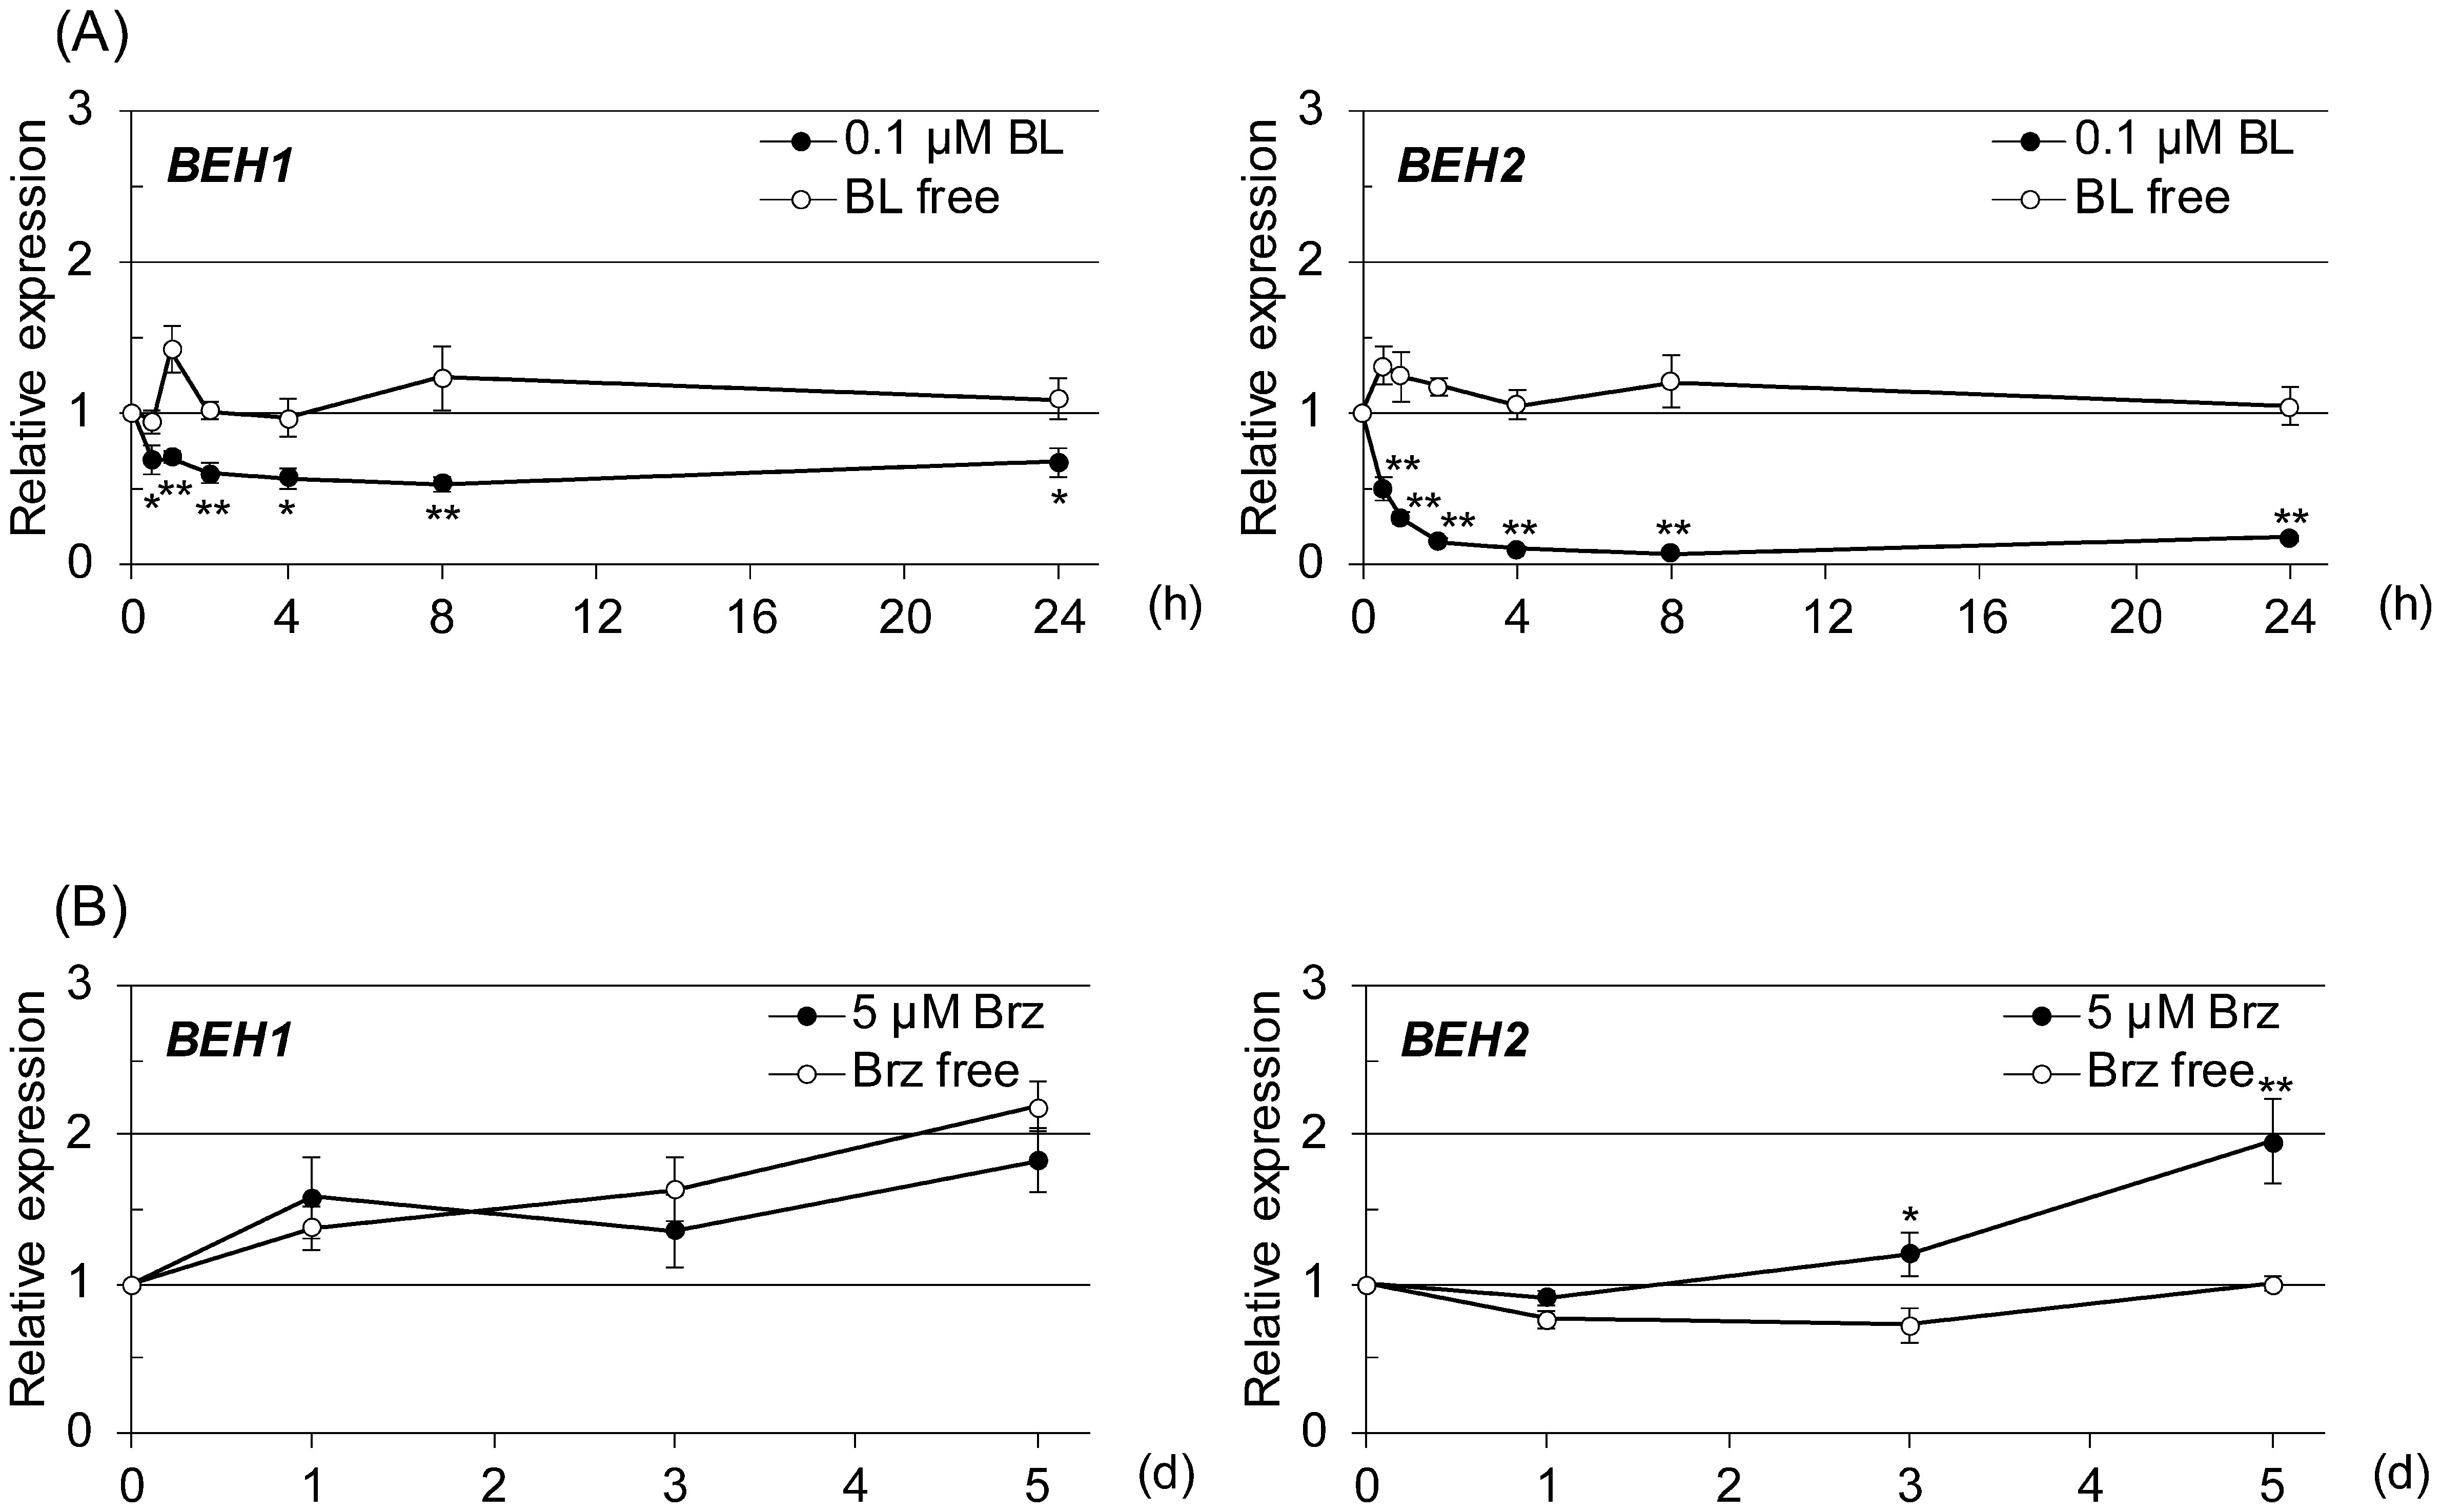
Fig. 4. qRT-PCR was used to evaluate the time-dependent response of BEH1 and BEH2 to an increased or decreased BR level in 2-wk-old seedlings. (A) Brassinolide (BL, 0.1 µM) was given to plants for the indicated number of hours following 2 days’ pretreatment with 5 µM brassinazole (Brz), a BR biosynthesis inhibitor. (B) Brz (5 µM) was applied directly to the seedlings for the indicated number of days. In the graphs, data are shown as relative values of the means with SE (set 1 for time 0), following normalization by that of ACT2. Statistical analyses were performed with Student’s t-test (*p<0.05, **p<0.01).