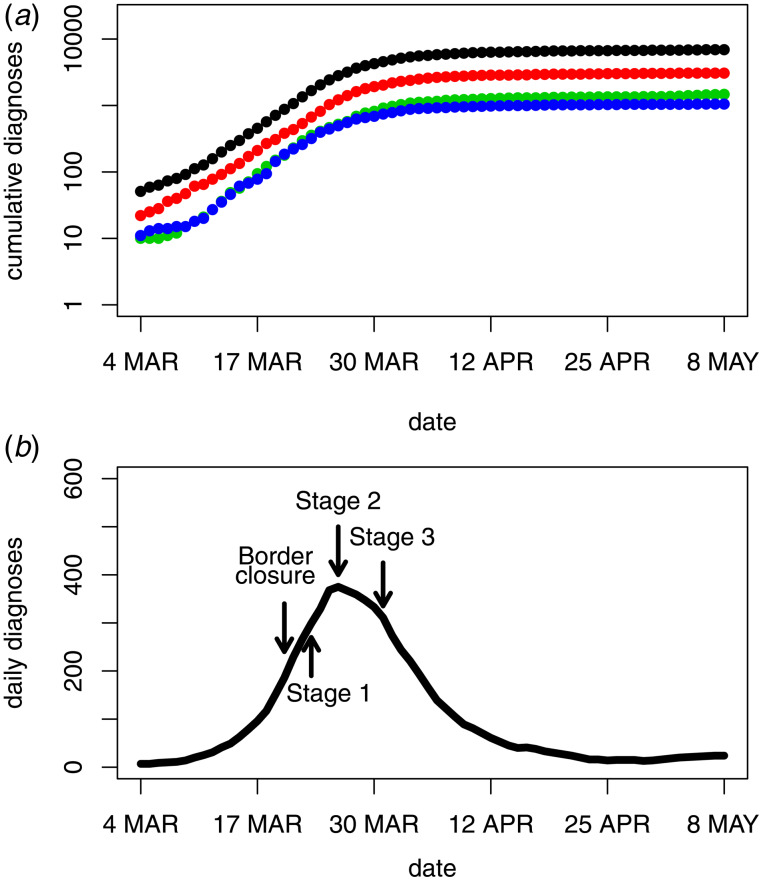
Fig. 2.
Daily COVID-19 diagnosis counts for Australia. Panel A plots the cumulative counts (log scale) for Australia (black) and the three states with the largest outbreaks, New South Wales (red), Victoria (green) and Queensland (blue). Panel B plots the smoothed daily number of new cases for Australia along with the timing of government restrictions.

