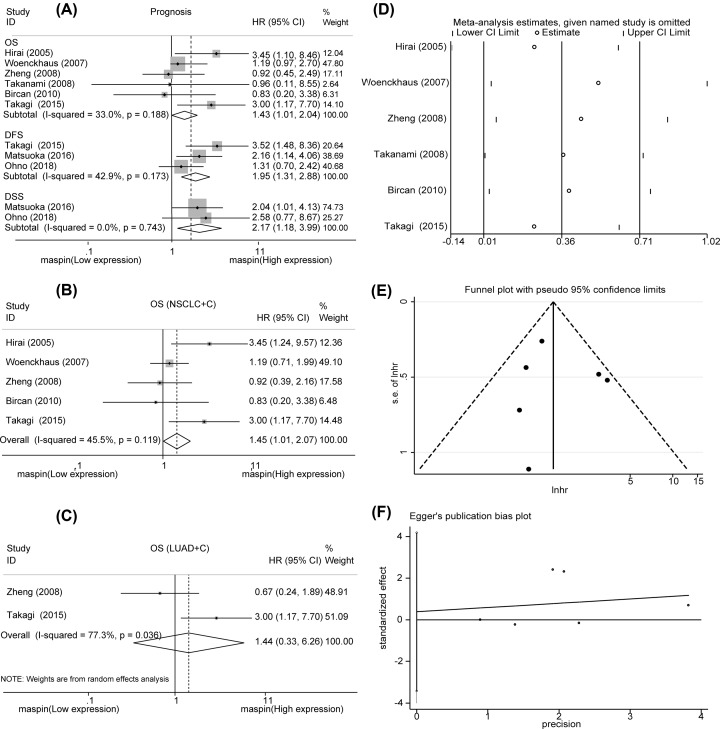
Figure 2. Forest plot of the HR for the correlation between survival rate and MASPIN expression.
(A) The association of MASPIN expression with OS, PFS, DFS, and DSS. (B,C) The association of MASPIN expression with OS by subgroup analysis. (D) Sensitivity analysis of OS. (E) Publication bias analysis of OS by funnel plot. (F) Publication bias analysis of OS by Egger’s test. Abbreviations: C, cytoplasm; CI, confidence interval; N, nucleus; T, total, T = C+N.

