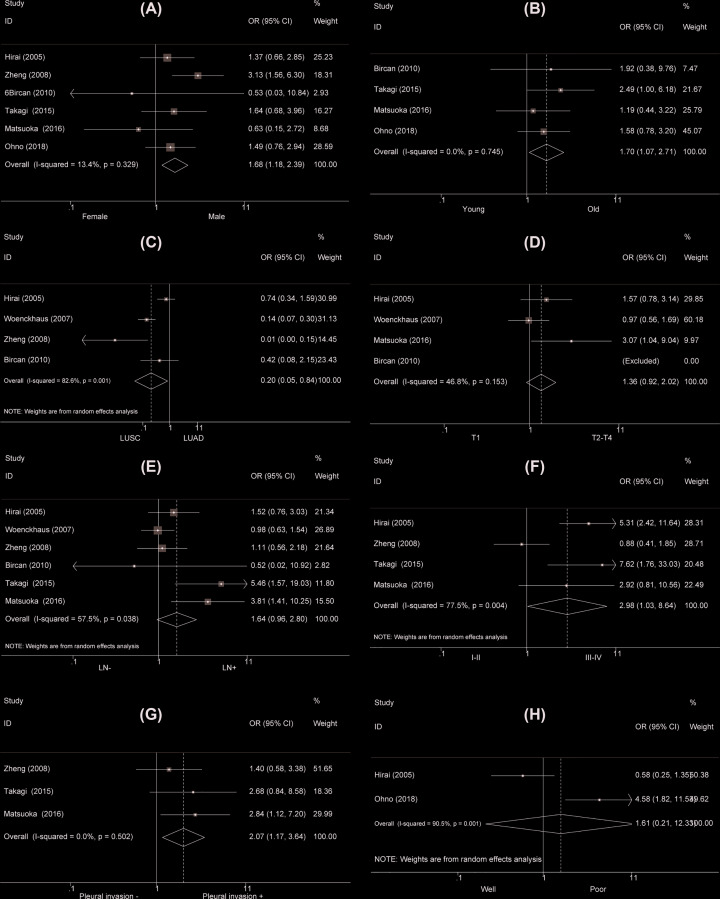
Figure 4. Forest plot for the relationship between cytoplasmic MASPIN expression and clinicopathological parameters of NSCLC.
(A) Gender (male versus female); (B) age (old versus young); (C) type (LUAD versus LUSC); (D) T stage (T2–4 versus T1); (E) TNM staging (III-IV vs I-II); (F) lymph node metastasis (LN+ vs LN−); (G) differentiation (poor versus well); (H) pleural invasion (yes versus no).

