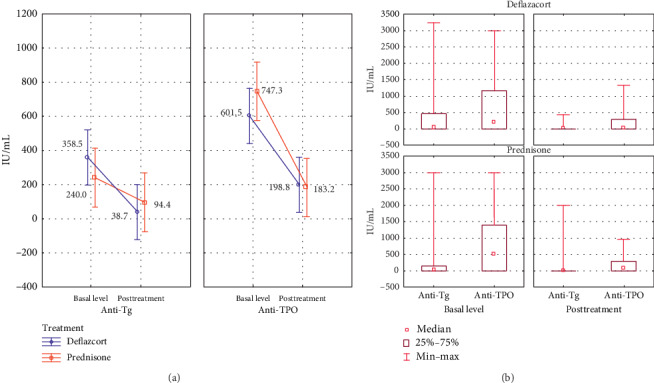
Figure 3.

(a) Variance analysis of the mean in anti-Tg and anti-TPO antibodies before and after steroid treatment. (b) Comparative analysis of the median response of the serum level of autoantibodies, ranges, and interquartile ranges according to the indicated treatment and titration phase. Follow-up was done three months after the initial treatment.
