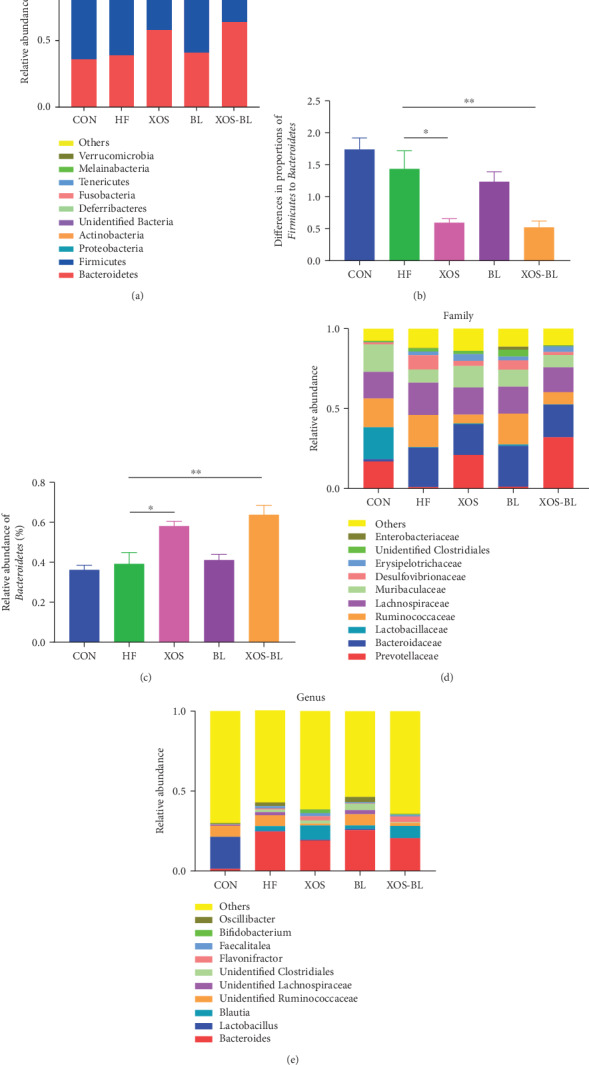
Figure 5.

Composition analysis of gut microbiota at different taxonomic levels among all samples. (a) The average abundance of microbial community in different groups at phylum level; (b) the ratio of Firmicutes to Bacteroidetes; (c) proportion of Bacteroidetes; (d) microbial community bar plot at family level; (e) microbial community bar plot at genus level. All values are mean ± SEM (n = 5‐6). The differences were assessed by one-way ANOVA with Tukey's test. ∗P < 0.05; ∗∗P < 0.01.
