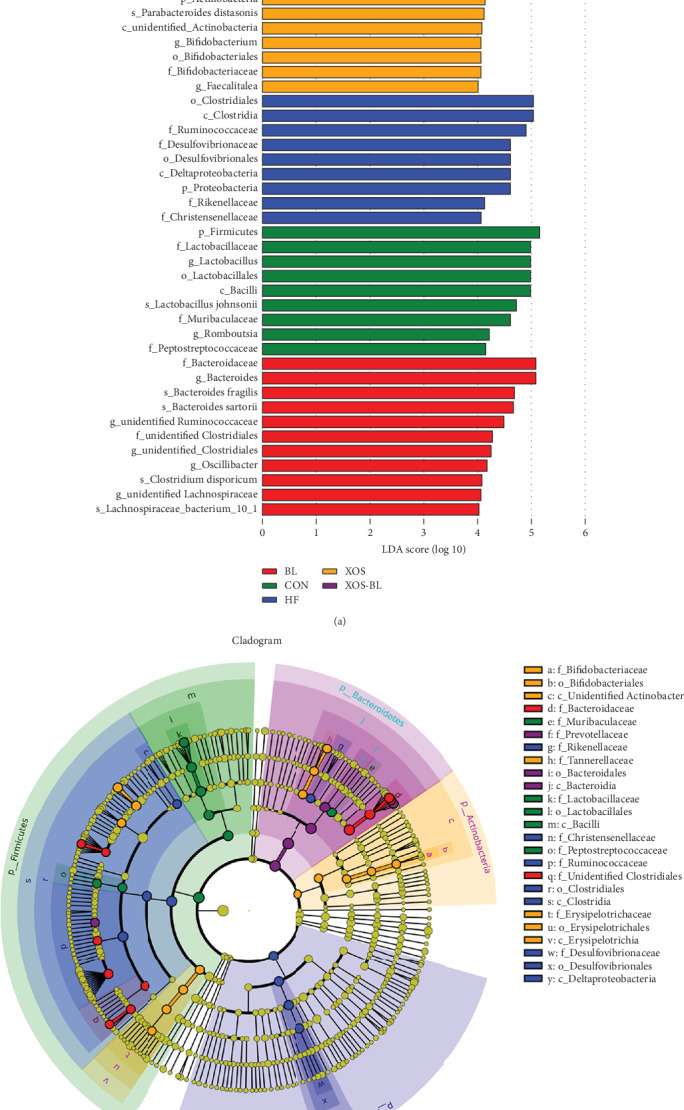
Figure 7.

LEfSe analysis of intestinal microbiota among different groups. (a) LEfSe identified the most differentially abundant bacterial taxons among groups. Group-specific enriched taxa are indicated with a positive LDA score bar with different colors. Only taxa meeting an LDA significant threshold > 4 are shown; (b) taxonomic cladogram obtained from LEfSe analysis of 16S rDNA sequences. The brightness of each dot is proportional to its effect size.
