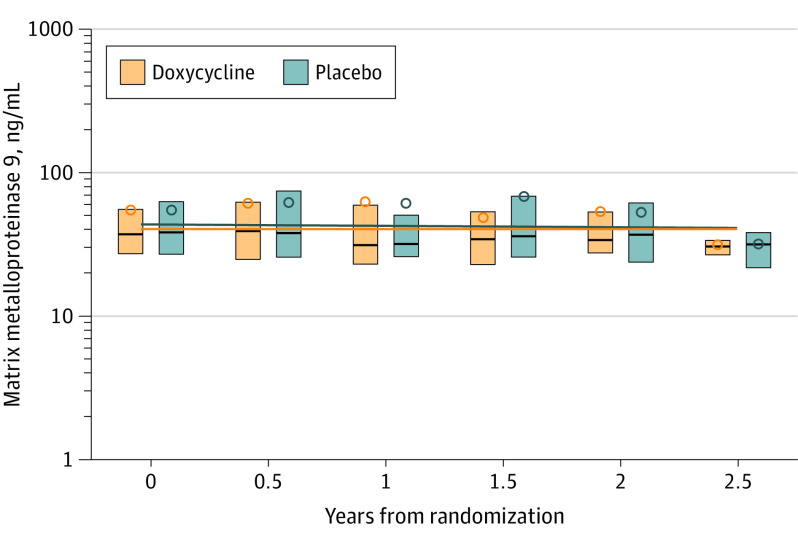
Figure 2. Estimates of Matrix Metalloproteinase 9 Levels on a Log Scale From Generalized Estimating Equations Analysis by Treatment Assignment.
The difference between doxycycline and placebo in slope per year is −0.001 (95% CI, −0.051 to 0.049; P = .86) for log(matrix metalloproteinase 9), ng/mL. Open circles represent mean values; lines in the boxes, medians; the box ends, interquartile ranges; and lines spanning boxes, slope.

