
Figure 1.
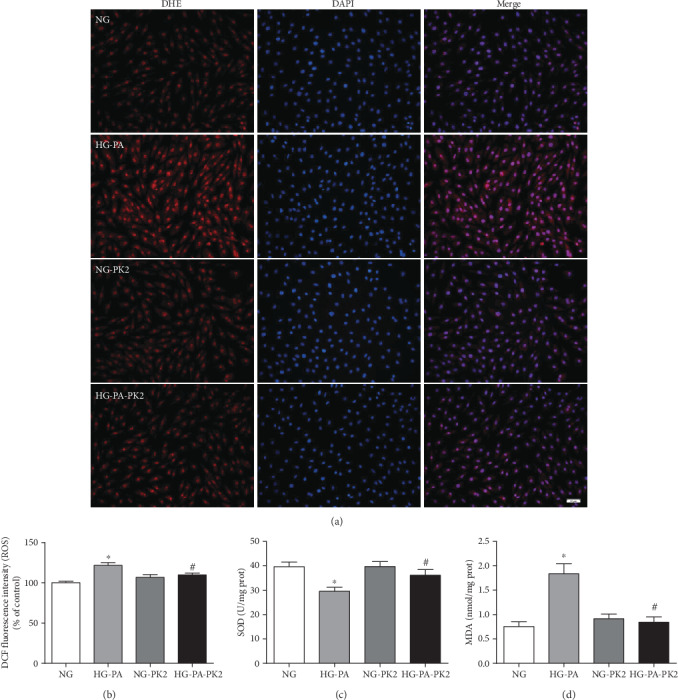
PK2 decreased intracellular ROS production in high glucose/high palmitic acid-treated cardiomyocytes. (a) Representative images of DHE staining, magnification = 200x, scale bar = 50 μm, n = 3 independent groups. (b) Quantification of DCFH-DA staining, n = 8independent groups. (c) SOD level, n = 7‐9 independent groups. (d) MDA level, n = 7‐10 independent groups. NG: normal glucose; HG-PA: high glucose/high palmitic acid; NG-PK2: normal glucose plus PK2; HG-PA-PK2: high glucose/high palmitic acid plus PK2. ∗P < 0.05 versus the NG group; #P < 0.05 versus the HG-PA group.