
Figure 2.
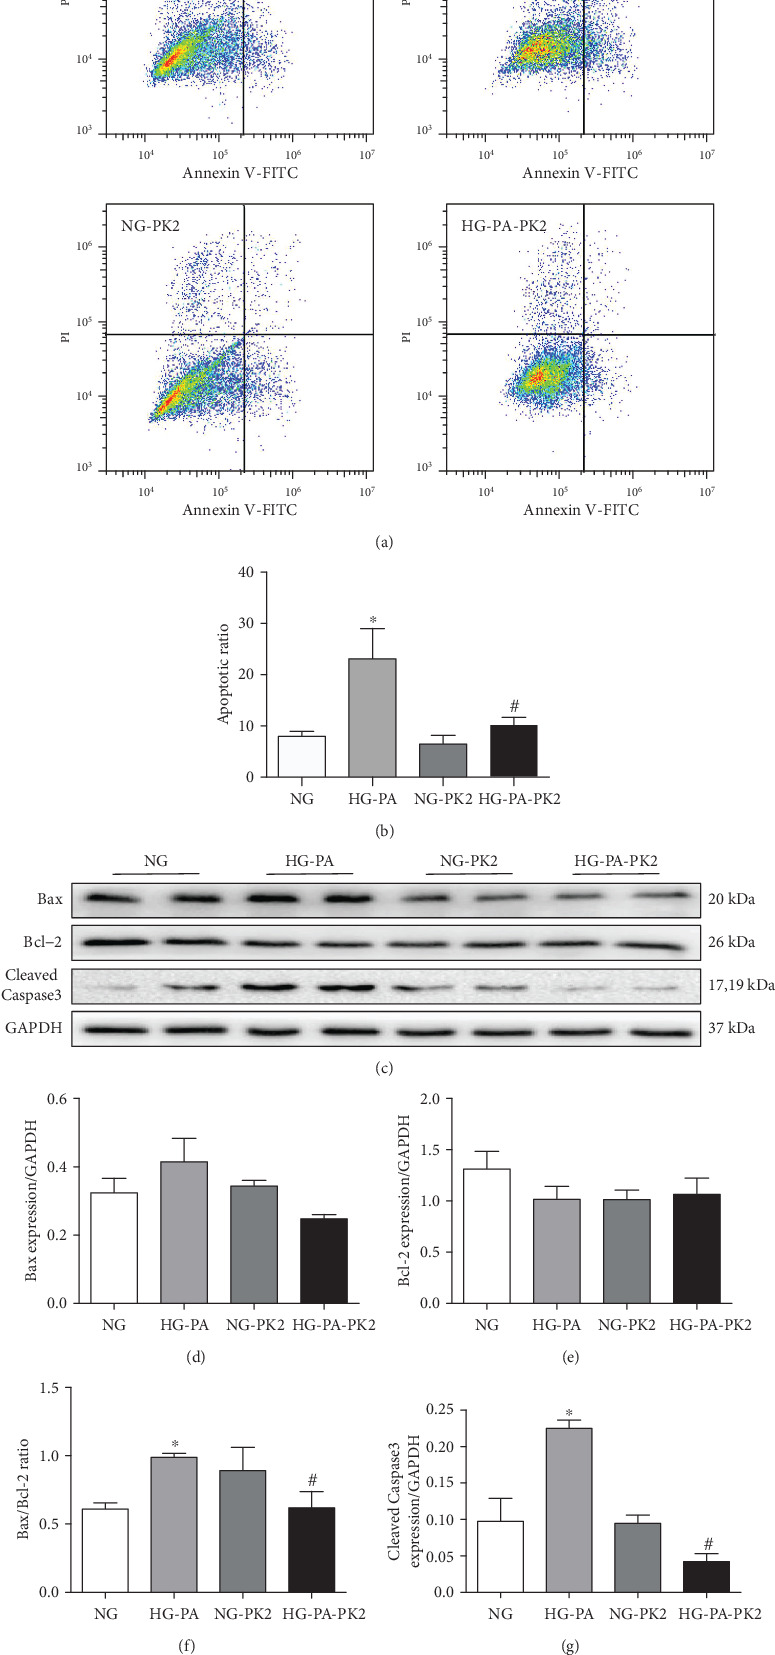
Effect of PK2 on cardiomyocyte apoptosis and apoptosis-related proteins induced by high glucose/high palmitic acid. (a) Cells were detected with a flow cytometer, n = 7‐11 independent groups. (b) Analysis of apoptosis. (c) Images of Bax, Bcl-2, and Cleaved Caspase3 proteins. (d) Analysis of Bax. (e) Analysis of Bcl-2. (f) Analysis of the Bax/Bcl-2 ratio. (g) Analysis of Cleaved Caspase3. ∗P < 0.05 versus the NG group; #P < 0.05 versus the HG-PA group; n = 3‐4 independent groups.