
Figure 5.
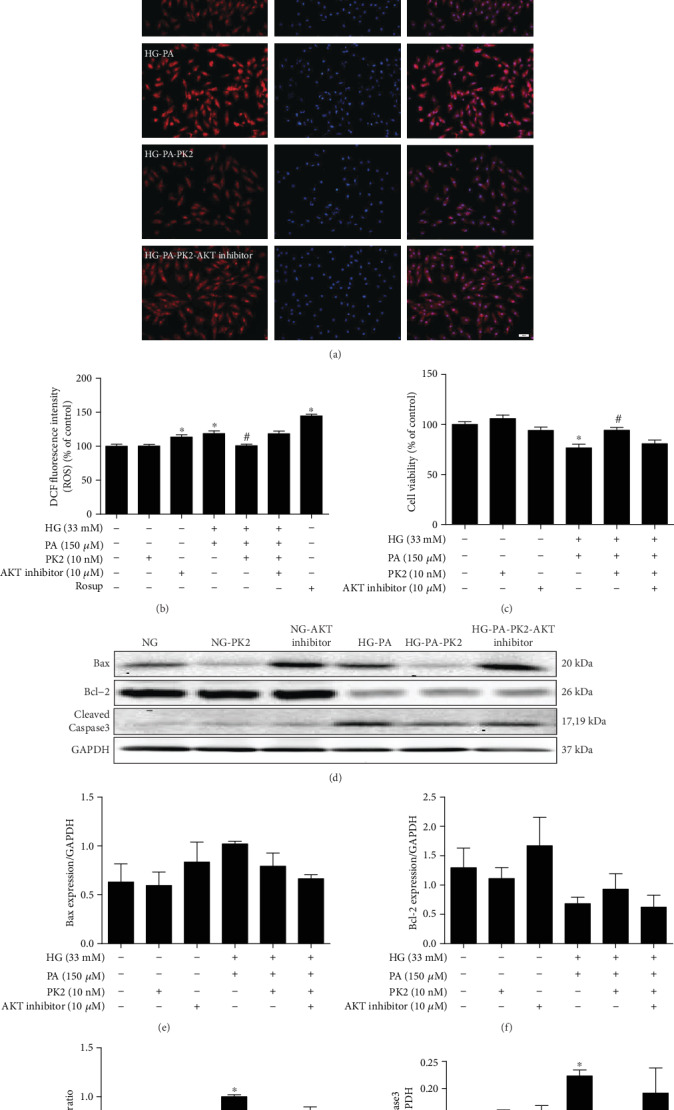
AKT inhibitor abolished the effects of PK2 on cardiomyocyte ROS production and apoptosis. (a) Representative images of DHE staining, magnification = 200x, scale bar = 50 μm, n = 3 independent groups. (b) Quantification of DCFH-DA staining, n = 12‐16 independent groups. (c) Cell viability. (d) Images of Bax, Bcl-2, and Cleaved Caspase3 protein expression. (e) Analysis of Bax. (f) Analysis of Bcl-2. (g) Analysis of the Bax/Bcl-2 ratio. (h) Analysis of Cleaved Caspase3. ∗P < 0.05 versus the NG group; #P < 0.05 versus the HG-PA group; n = 3‐4 independent groups. NG: normal glucose; NG-PK2: normal glucose plus PK2; NG-AKT inhibitor: normal glucose plus AKT inhibitor; HG-PA: high glucose/high palmitic acid; HG-PA-PK2: high glucose/high palmitic acid plus PK2; HG-PA-PK2-AKT inhibitor: high glucose/high palmitic acid plus PK2 plus AKT inhibitor.