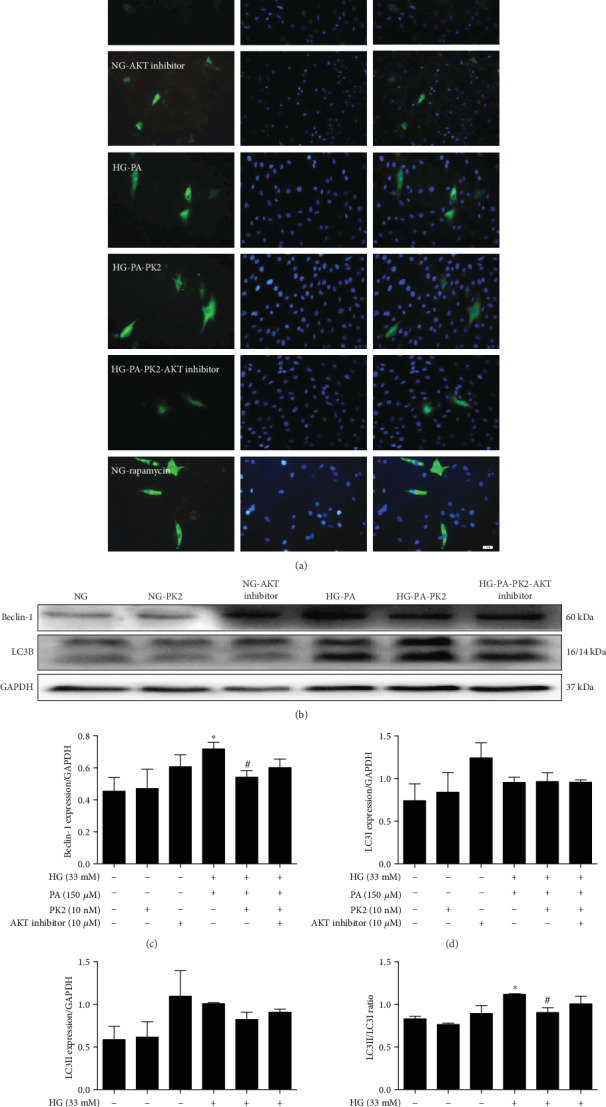
Figure 6.

AKT inhibitor counteracted the effects of PK2 on cardiomyocyte autophagy. (a) Representative images of autophagy indicated by GFP-LC3, magnification = 200x, scale bar = 50 μm, n = 3 independent groups. (b) Images of Beclin-1 and LC3B protein expression. (c) Analysis of Beclin-1. (d) Analysis of LC3I. (e) Analysis of LC3II. (f) Analysis of the LC3II/LC3I ratio. ∗P < 0.05 versus the NG group; #P < 0.05 versus the HG-PA group; n = 3 independent groups.
