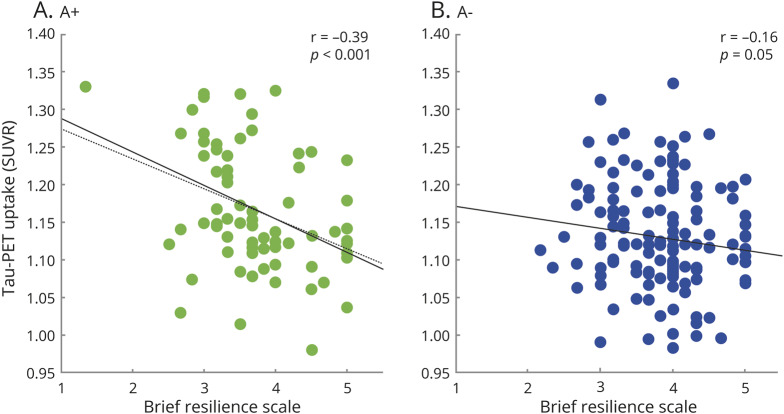
Figure 2. Plots show the association between mean tau-PET uptake of the areas from the voxel-wise analysis (inferior and medial temporal lobes, occipito-temporal and cuneal/precuneus cortices, Y axis) and stress coping scale in amyloid-positive and amyloid-negative participants (X axis).
(A) Amyloid-positive group. (B). Amyloid-negative group. The discontinuous line in the A+ group plot (A) represents the regression line without the participant showing the lowest stress coping score (r = −0.36; p = 0.002). SUVR = standard uptake value ratio.

