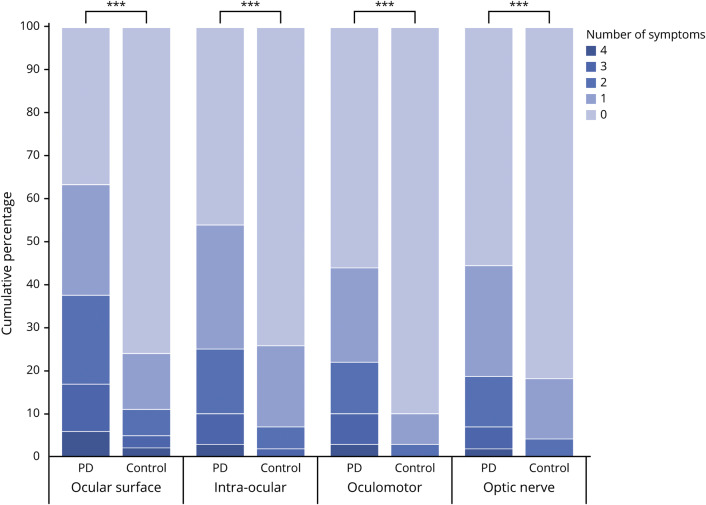
Figure 2. Number of ophthalmologic symptoms reported per domain compared between patients with Parkinson disease (PD) and controls.
Each pair of bars represents patients with PD and healthy controls. The bars are divided into the cumulative percentages of participants reporting no ophthalmologic symptoms, 1 ophthalmologic symptom, 2 ophthalmologic symptoms, 3 ophthalmologic symptoms, or 4 ophthalmologic symptoms. For example, in the domain of the ophthalmologic surface, only 37% of the patients with PD reported no symptoms, compared with 76% in the control group. In the control group in the domains intraocular, oculomotor, and optic nerve the option “4 symptoms” is 0%. In the control group in the domains oculomotor and optic nerve the option “3 symptoms” is 0%. ***p < 0.001.

