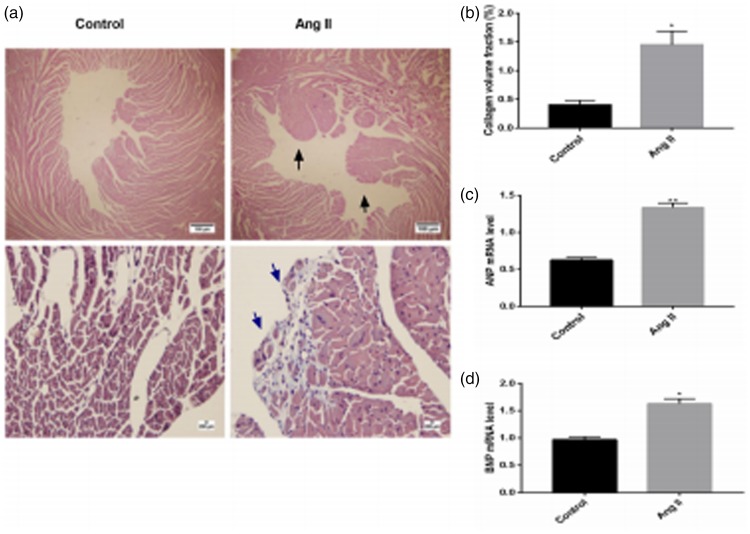
Figure 2.
(a) Hematoxylin and eosin staining of mouse myocardial tissue. (b) Collagen volume fraction of mouse myocardial tissue (*P < 0.05 versus the control group). Black arrows indicate increased papillary muscle of mice and blue arrows indicate fibrosis. (c) Expression of the hypertrophic marker atrial natriuretic peptide (ANP) (**P < 0.01 versus the control group). (D) Expression of the hypertrophic marker brain natriuretic peptide (BNP) (*P < 0.05 versus the control group). Ang II, angiotensin II.

