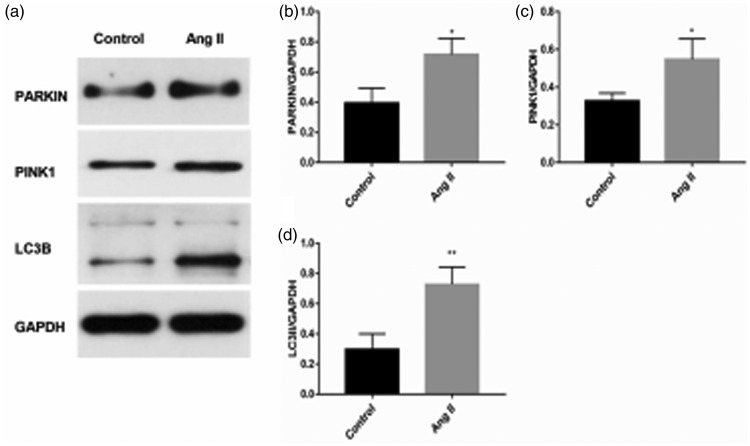
Figure 5.
(a–d) Western blot analysis of PINK1, Parkin, and LC3 II protein levels of mice myocardium. *P < 0.05, **P < 0.01. Ang II, angiotensin II; PINK1, phosphatase and tensin homolog-induced putative kinase 1; LC3, microtubule-associated protein 1A/1B-light chain 3, GAPDH, glyceraldehyde-3-phosphate dehydrogenase.

