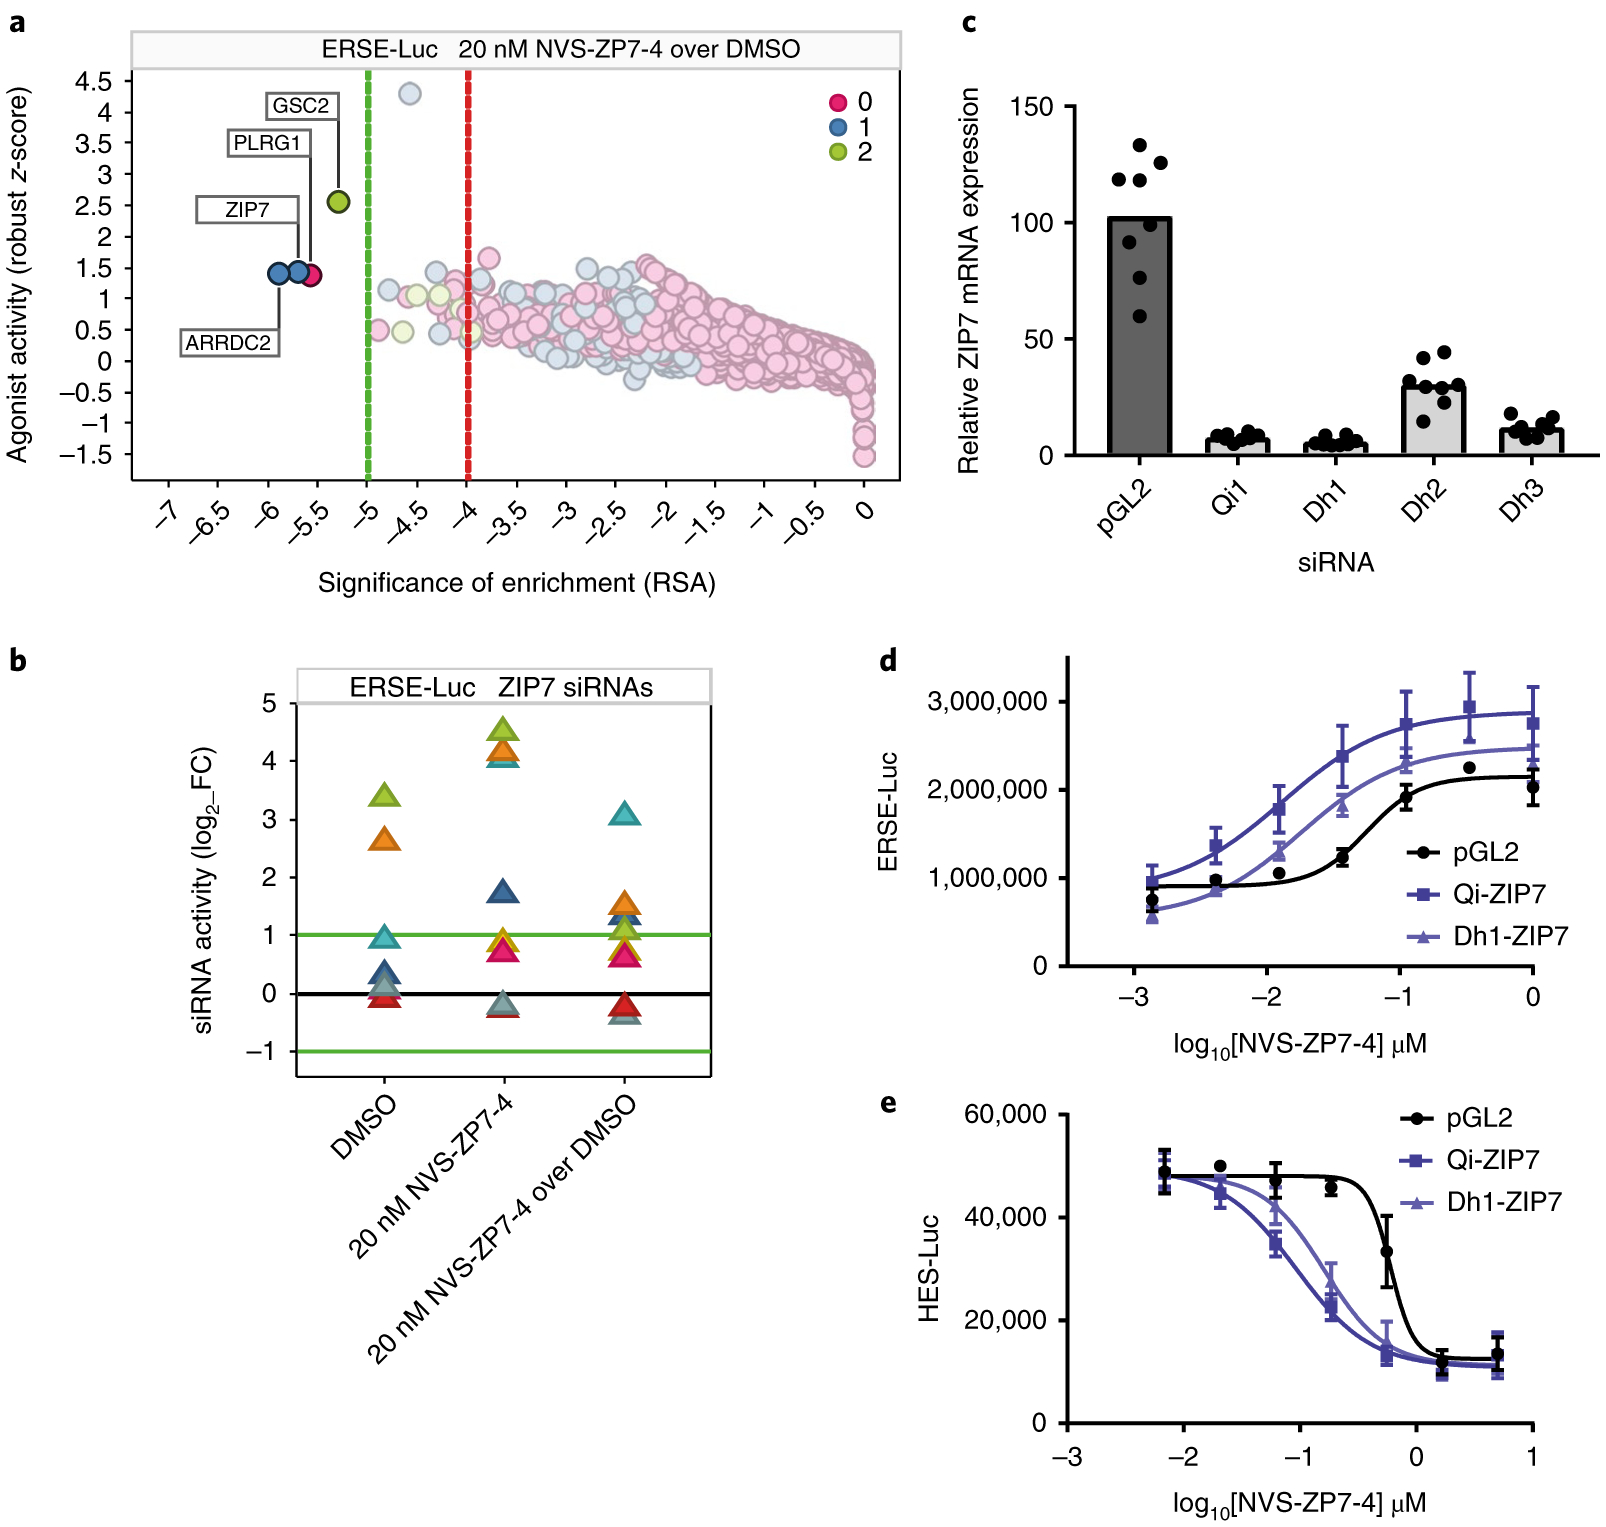
Fig. 4 |. Genetic screens reveal increased ER stress and decreased Notch signaling following ZIP7 siRNA knockdown.

a, Gene on-target activity in the ERSE-Luc assay agonist side (increased signaling) was plotted as robust z-score (activity of the 75th percentile siRNA per gene) as a function of RSA (significance of enrichment) for NVS-ZP7–4 over DMSO control. Color was set to depict the number of siRNAs per gene with significant activity (robust z-score > + 2). Dotted lines represent stringent (green) and loose (red) thresholds of significance of enrichment, determined on the basis of randomized dataset analysis. b, The impact of the individual ZIP7 siRNAs (log2 fold change; luminescence for test siRNA over median luminescence for all siRNAs) in the ERSE-Luc assay is shown for each of the three screening conditions (DMSO, 20 nM NVS-ZP7–4, 20 nM NVS-ZP7–4 over DMSO). c, Quantitation of ZIP7 mRNA expression after treatment of HSC-3 cells with control (pGL2) or four independent ZIP7 siRNAs for 24 h. Data are representative of eight technical replicates from one biological sample represented in a box-plot graph. d, NVS-ZP7–4 dose response in ERSE-Luc assay in combination with siRNA knockdown with two independent ZIP7 siRNAs or a control siRNA (pGL2). Error bars represent s.d. of the mean from six biological replicates (n = 6) in an individual experiment. Each experiment was performed three independent times. e, NVS-ZP7–4 dose response in Notch signaling HES-luciferase assay in combination with siRNA knockdown with two independent ZIP7 siRNAs or a control siRNA (pGL2). Error bars represent the s.d. of the mean from six biological replicates (n = 6) in an individual experiment. Each experiment was performed three independent times.
