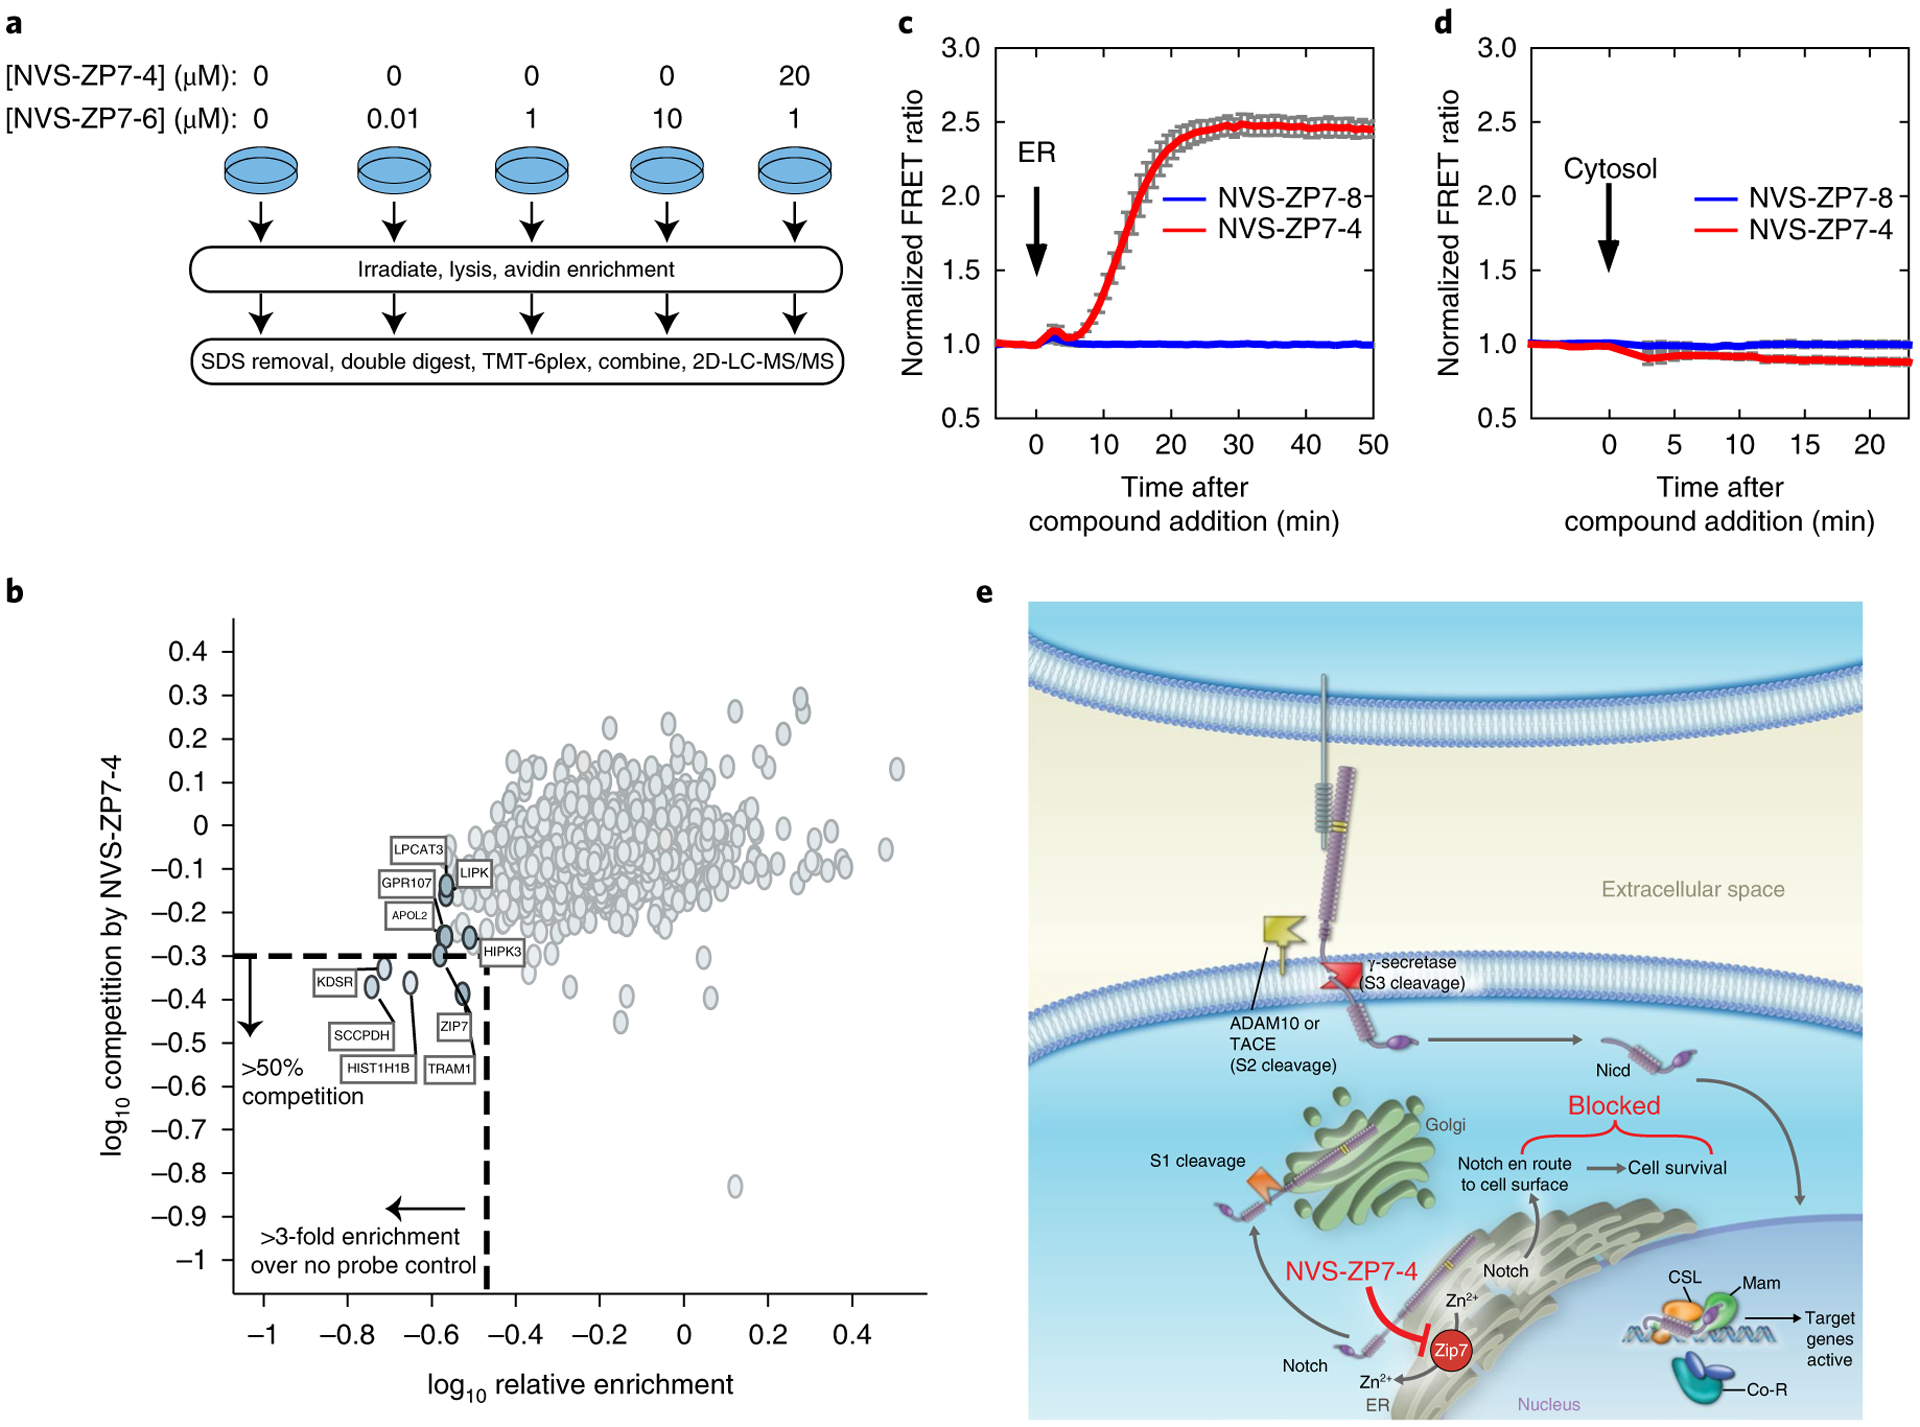
Fig. 6 |. NVS-ZP7–4 interacts with ZIP7, increases ER Zn2+ levels in the ER and modulates Notch signaling.

a, Schematic overview of photoaffinity labeling probe titration strategy. Cells were treated with varying concentrations of the NVS-ZP7–6 to identify proteins with saturatable binding. Additionally, cells were pretreated with NVS-ZP7–4 to identify that proteins specifically bound the pharmacophore. NGS, next generation sequencing. b, Identification of proteins that are enriched by NVS-ZP7–6 and where this labeling can be competed by NVS-ZP7–4. The x axis denotes the enrichment observed in the presence of 1 μM NVS-ZP7–6 relative to 0 μM NVS-ZP7–6 (log10 (0 μM NVS-ZP7–6/1 μM NVS-ZP7–6)). Proteins to the left of the vertical dashed lined are enriched by more than threefold over no probe control. Plotted on the y axis is the magnitude of competition observed in the presence of pre-incubated free competitor compound NVS-ZP7–4. Proteins below the dashed horizontal line show ≥ 50% reduction in enrichment in the presence of 20 μM NVS-ZP7–4 (log10 ((20 μM NVS-ZP7–4 + 1 μM NVS-ZP7–6)/1 μM NVS-ZP7–6). c, Quantitation of Zn2+ levels in the ER following NVS-ZP7–4 treatment. U2OS cells were transfected with ER-ZapCY1 for 24 h before imaging. Cells were treated with 1 μM NVS-ZP7–8 (blue, n = 7 cells) or 1 μM NVS-ZP7–4 (red, n = 6 cells) at the time indicated by the arrow. FRET ratios were normalized to the average FRET ratio of each cell before compound treatment. Error bars are the s.e.m. d, Quantitation of cytosolic Zn2+ levels following NVS-ZP7–4 treatment. U2OS cells were transfected with NES-ZapCV2 24 h before imaging. Cells were treated with 1 μM NVS-ZP7–8 (blue, n = 4 cells) or 1 μM NVS-ZP7–4 (red, n = 4 cells) at the time indicated by the arrow. FRET ratios were normalized to the average FRET ratio of each cell before compound treatment. Error bars are the s.e.m. e, Model of ZIP7 modulation by NVS-ZP7–4 and effects on Notch signaling.
