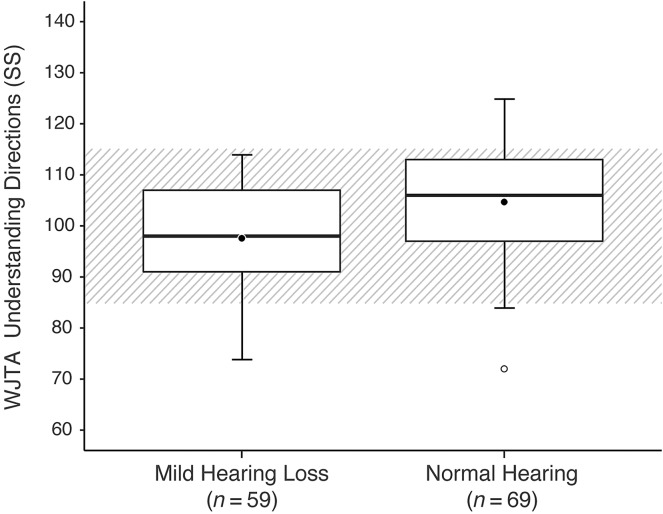
Figure 1.
Box plots of Woodcock-Johnson Tests of Achievement (WJTA) Understanding Directions standard scores (SS) for children with mild hearing loss (left) and children with normal hearing (right). The central lines represent the median values, the filled circles represent the mean values, and the box limits are the 25th and 75th percentiles. The lower and upper fences are the 5th and 95th percentiles. Open circles represent outliers. The hatched area represents the average range for the normative sample.

