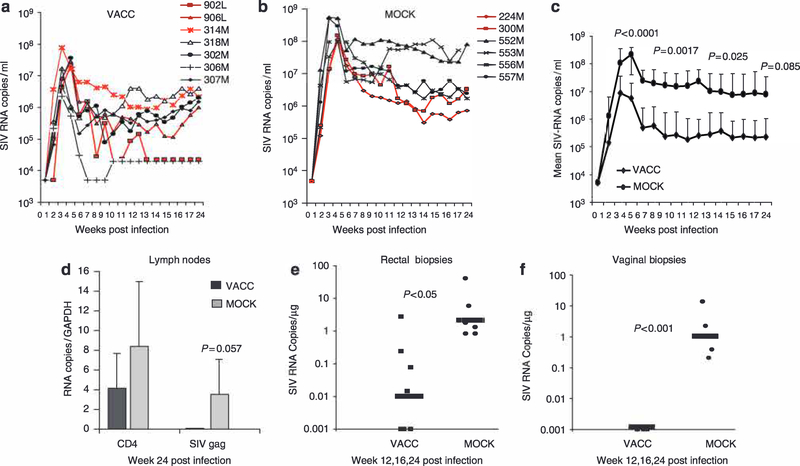
Figure 2.
Virological outcome following intrarectal challenge exposure to SIVmac251. (a) Plasma virus level in each macaque from the vaccinated group (VACC) and (b) mock-vaccinated group (MOCK). Mamu-A*01+ animals in each group are identified with bold character in the legend and with red symbols and lines in the graphs. (c) Geometrical mean virus load in vaccinated and mock-vaccinated group. Bars represent standard deviation. The P-values refer to weeks 2, 12, 16, and 24 after challenge. (d) CD4 mRNA expression and simian immunodeficiency virus (SIV) Gag RNA copies in mononuclear cells from axillary lymph nodes of vaccinated (n=5; 902L, 906L, 306M, 318M, 307M) and mock-vaccinated animals (n=5; 224M, 300M, 552M, 556M, 557M) at week 24 post-infection. Data are represented as average values plus standard deviations. (e) SIV-RNA Gag copies for microgram of total RNA in rectal biopsies (f) or vaginal biopsies collected from the seven vaccinated and the five mock-vaccinated animals during the course of chronic infection, at weeks 12, 16, and 24 weeks post-challenge. The horizontal bars represent the average value in each group.

