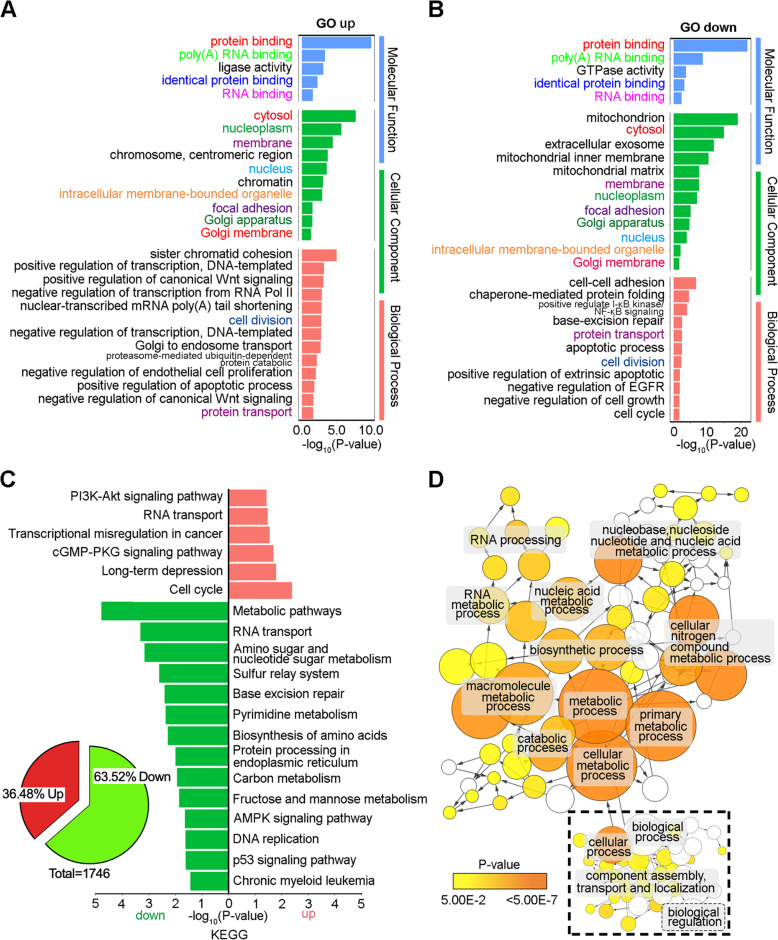
Fig. 5.
Global gene expression profiling of CD133 KO and WT hESCs by RNA-seq. a, b Significant gene ontology (GO) analyses of differentially expressed genes in CD133 KO hESCs compared with WT hESCs (passage 20) (fold change ≥ 1.5). c KEGG pathway enrichment analysis of differential expression genes in CD133 KO versus WT hESCs. Left panel shows percentage of globally down- and upregulated genes. Y-axis shows the pathway category and X-axis shows the negative logarithm of the P value (−LgP). A larger –LgP indicate a smaller P value for the difference. d Interaction network using Cytoscape plug-in BinGO indicates main downregulated metabolic process. Yellow nodes: nodes with P value < 0.05 and multiple testing corrected by Benjamini and Hochberg false discovery rate (FDR) correction. Dotted box indicates other biological processes that potentially regulate the metabolic process

