Figure 3.
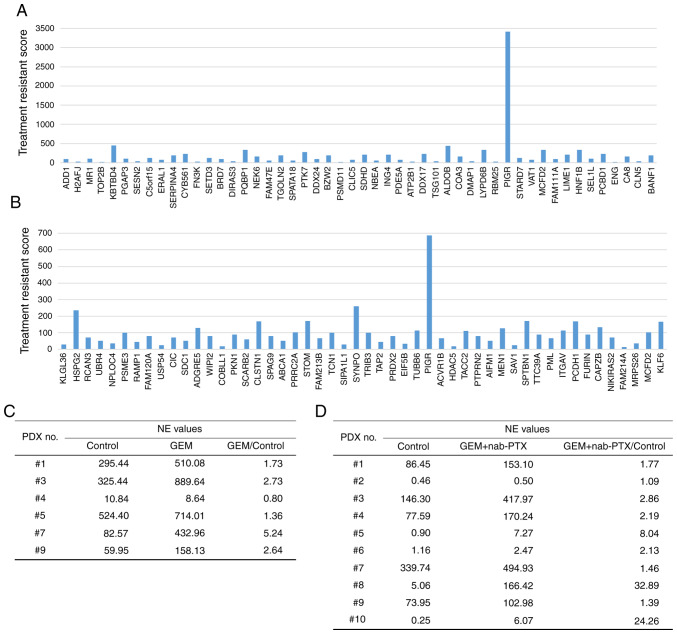
Identification of chemotherapy resistance-related molecules. (A and B) NGS analysis for the (A) GEM administration and (B) GEM + nab-PTX administration groups. Treatment resistance score was defined as the NE value ratio (treated group/control group) × NE value difference (treated group-control group). (C and D) The ratio of NE values for pIgR expression between the treated and control groups tended to be greater than 1.0 for most of the PDXs treated with (C) GEM or (D) GEM + nab-paclitaxel. NGS, next-generation sequencing; GEM, gemcitabine; nab-PTX, nab-paclitaxel; NE, normalized expression; pIgR, polymeric immunoglobulin receptor; PDX, patient-derived xenografts.

