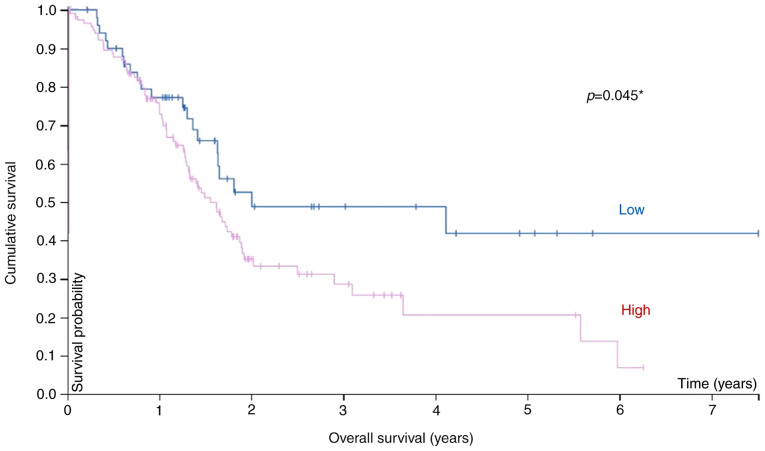
Figure 4.
Kaplan-Meier plot summarizing the results from analysis of the associations between pIgR mRNA expression and patient survival in TCGA pancreatic cancer database (n=171). Red line, high expression (n=119); blue line, low expression (n=52). pIgR, polymeric immunoglobulin receptor; TCGA, The Cancer Genome Atlas. *Statistically significant.

