Figure 2.
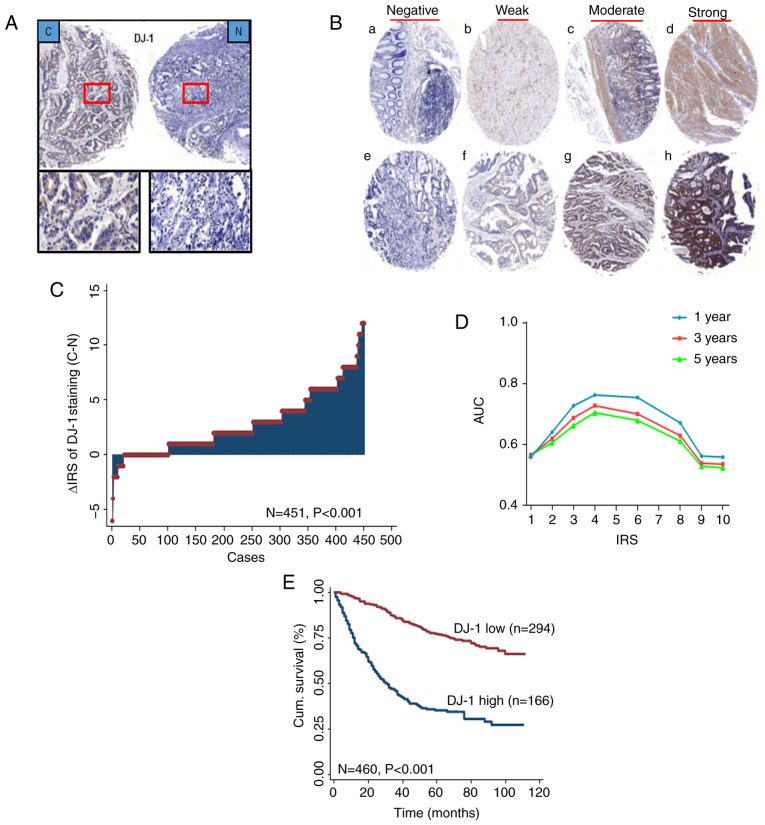
DJ-1 is elevated in CRC and associated with poor prognosis of CRC patients. (A) Representative images of DJ-1 immunohistochemical staining in TMA are shown: Top panels, original magnification, ×40; bottom panels, ×200. (B) Representative images of DJ-1 immunohistochemical staining in CRC cancer and adjacent normal tissues. (a-d) Adjacent normal tissue and (e-h) cancer tissue. (a and e) Negative staining, (b and f) weak staining, (c and g) moderate staining and (d and h) strong staining. All panels, original magnification, ×40. (C) Distribution of the difference in DJ-1 staining in CRC compared with that in the paired normal tissues in the TMA. The expression of DJ-1 was higher in cancer tissues than normal tissues (P<0.001). (D) Area under the curve (AUC) at different cut-off values for DJ-1 immunoreactivity score (IRS) for 1-, 3- and 5-year OS. The optimal cut-off point of DJ-1 IRS was 4. (E) Kaplan-Meier curves of the patients with low/high DJ-1 expression. CRC patients with high DJ-1 expression had a worse OS than the patients with low expression (P<0.001). CRC, colorectal cancer; TMA, tumor microarray; OS, overall survival.

