Figure 1.
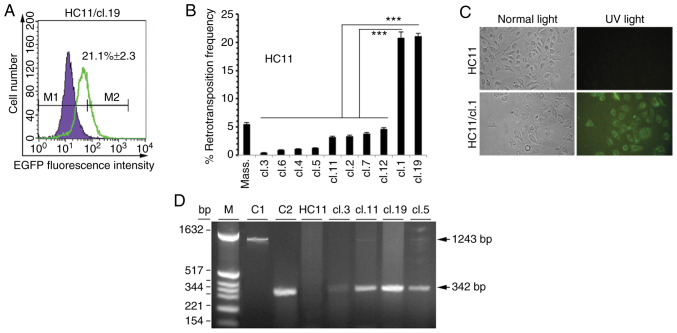
VL30 retrotransposition in HC11 cells. (A and B) Samples of 15,000 cells from control HC11, and isolated single or massive clones (Mass.) were measured for EGFP positivity with FACS. Overlaid violet filled-histogram and green non-filled histogram profiles in panel A represent fluorescence of control HC11 and HC11/cl.19 cells, respectively. M1 and M2 are threshold settings for control auto-fluorescence and sample fluorescence. Percentage value shown inside of histogram A, subtracted by 0.4% (false positive at M2), is the net frequency of EGFP-positive cells as the mean value ±SD of samples in triplicate. (B) Columns represent the mean value of net retrotransposition frequencies of duplicate samples from three independent experiments with ±SD indicated with bars. Statistical significance of compared group data shown: ***P<0.0001 (Tukey's post hoc test after ANOVA). (C) HC11 and HC11/cl.1 cells grown on glass coverslips were fixed with 3.7% paraformaldehyde and photographed (magnification, ×40) under normal (left panels) and UV light (right panels), respectively. (D) PCR products from DNA lysates of retrotransposition-positive clones separated on a 1.2% (w/v) agarose gel. Lanes C1 and C2 correspond to PCR reactions with pNVL-3*/EGFP-INT and pEGFP-N1 plasmids as positive controls for the 1243bp and 342bp bands, respectively. Lane HC11 represents a reaction with HC11 DNA lysate, as negative control. M denotes pBR322/HinfI molecular mass-size markers.

