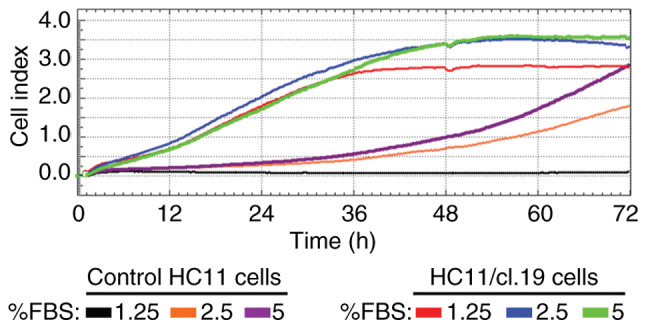
Figure 4.

RTCA proliferation rates of HC11 retrotransposition-positive cells in low serum-media. 5,000 cells deriving from either control HC11 or HC11/cl.19 cells, in a volume of 100 µl RPMI medium supplemented with low FBS concentration, transferred and cultured in wells of an E-16 plate. Samples were analyzed in duplicate (n=2). Representative colored proliferation curves correspond to each FBS concentration shown by respective color bars, at the bottom. Cell index refers to cell proliferation rate.
