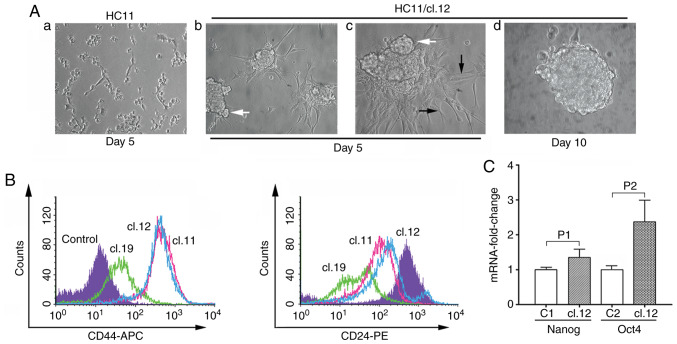
Figure 5.
Mammosphere formation in anchorage-independent growth conditions, CD44/CD24 antigen analysis and RNA expression levels of Nanog and Oct4 genes in HC11 retrotransposition-positive cells. (A) 0.2×10⁶ trypsinized control HC11 or HC11/cl.12 cells were seeded into non-adherent plates and cultured for 10 days. White arrows (in panels b and c) indicate mammospere outgrowth, while black ones (in panel c) filopodia-like structures. In panel d, a fully formed-floating mammosphere is illustrated after 10 days of culture. Magnification, ×20 in (a and b), and ×40 in (c and d). Data shown are representative of 3 experiments. (B) 15,000 cells of clones 11, 12 and 19 stained with specific CD44 or CD24 antibodies were analyzed by FACS (n=3). Filled-histogram in violet represents control HC11 cells while empty color-histograms in green, light blue and pink correspond to clones 19, 12 and 11, respectively. (C) Total RNA isolated from control HC11 or mammospheres of retrotransposition-positive clone 12 cells was subjected to RT-qPCR analysis with designed Nanog or Oct4 gene primers (please see Materials and Methods). Columns represent the mean value of mRNA expression measurements with ±SD indicated with bars (n=3). Filled columns indicate mammosphere mRNA expression levels of Nanog or Oct4 genes, while empty C1 and C2 columns their respective HC11 control levels. GAPDH was used as control cDNA template normalization. P1 and P2 correspond to statistically significance values of 0.0198 and 0.0119, respectively (paired sampler Student's t-test).

