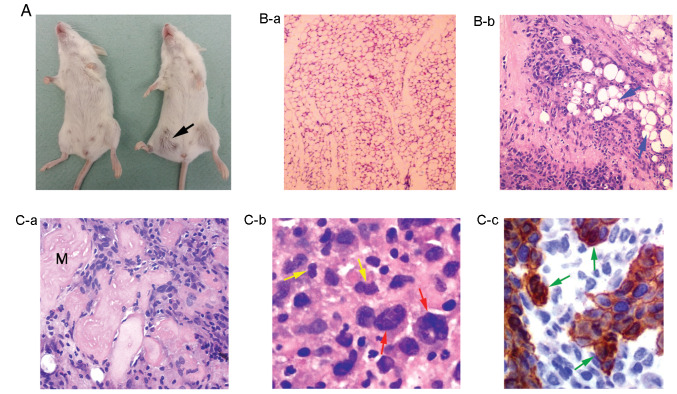
Figure 7.
Tumorigenicity of massive VL30 retrotransposition-positive cells in Balb/c mice. (A) Presentation of Balb/c mice injected either with 5×10⁶ normal HC11 (left mouse) or massive VL30 retrotransposition-positive clone cells (right mouse). Black arrow indicates both the location of cell injections performed and a tumor developed after injection with retrotransposition-positive cells. (B-a and -b) Adipose tissue sections from a mouse injected with HC11 cells (Β-a), and developed tumor (Β-b) stained with hematoxylin and eosin. Blue-stained nuclei in (Β-b) correspond to invasive tumor cells into the adipose tissue, and blue arrows indicate adipocyte clusters. (C-a-c) Tumor analysis. ‘M’ in panel C-a denotes skeletal muscle tissue surrounded by tumor cells. A higher magnification of tumor tissue cells is shown in panel C-b where red and yellow arrows indicate enlarged polymorphic nuclei with multiple nucleoli and mitotic cells, respectively. Panel C-c shows cytokeratin-positivity of tumor cells at high magnification, in a tissue location beyond the initial injection site. Green arrows indicate clusters of cytokeratin-positive cells. Panels B-a and -b are shown at a ×4 and ×20 magnification, respectively. Panels in C-a-c, initially taken at ×20 for C-a and ×40 for C-b and -c, are presented at a higher magnification. B-b and C-a-c are representative photographs derived from the analysis of 3 tumor sections (n=3).

