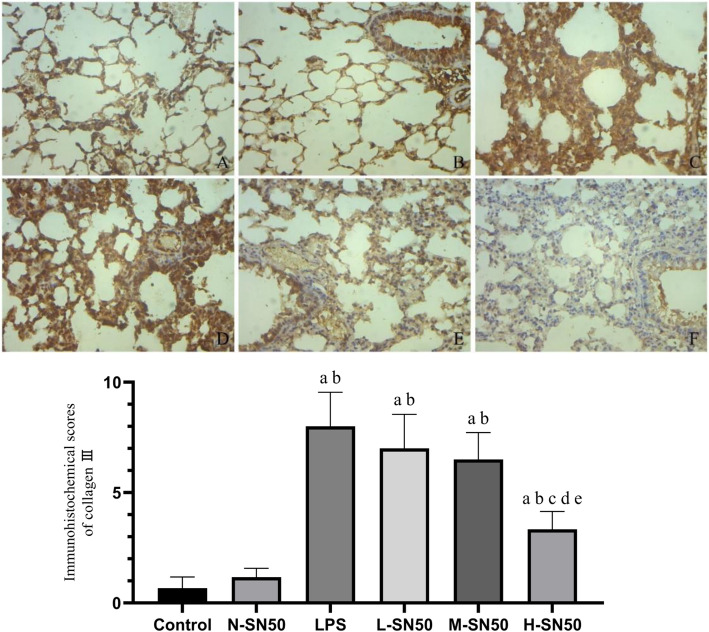
Fig. 5.
Collagen III expression in lung tissue and its immunohistochemical scores
The figure demonstrates a representative view (× 100) from each group. Each bar represents the mean ± SD. The LPS group showed deepest staining, indicating that collagen III expression was significantly increased. Following with SN50 intervention, collagen III expression decreased obviously and the staining faded. ap<0.05 compared with Control. bp<0.05 compared with N-SN50. cp<0.05 compared with LPS. dp<0.05 compared with L-SN50. ep<0.05 compared with M-SN50. (A, Control group; B, N-SN50; C, LPS group; D, L-SN50, E, M-SN50, F, H-SN50).

