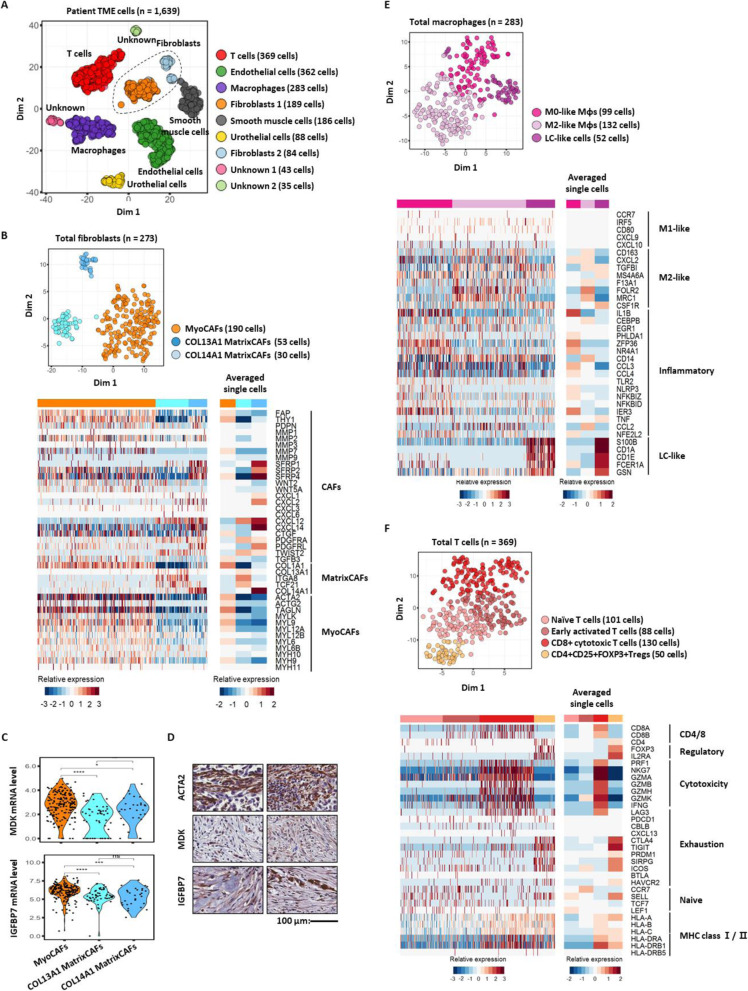
Fig. 5.
Parallel analysis of the tumor microenvironment in BC159-T#3. a tSNE plot of non-tumor cells (dots) from BC159-T#3 sample, color-coded by cluster; fibroblasts are circled. b tSNE plot of human fibroblasts (dots), color-coded by cluster (top panel). Heatmaps of single cells (bottom left panel) and averaged single cells (bottom right panel) represent the mRNA expression levels of well-known markers for fibroblasts. c Violin plots of MDK and IGFBP7 mRNA expression levels in three fibroblast clusters. Abbreviations: MyoCAFs, cancer-associated myofibroblasts; COL13A1 MatrixCAFs, COL13A1 expressing cancer-associated matrix fibroblasts; COL14A1 MatrixCAFs, COL14A1 expressing cancer-associated matrix fibroblasts. ****P < 0.0001, ***P < 0.001, **P < 0.01, *P < 0.05. d Validation of protein expression of IGFBP7 and MDK in fibroblasts (ACTA2 positive) from BC159-T#3 by immunohistochemistry staining. Scale bar, 100 μm. e tSNE plot of human macrophages (dots), color-coded by cluster (top panel). Heatmaps of single cells (bottom left panel) and averaged single cells (bottom right panel) represent the mRNA expression levels of well-known markers for macrophage subtypes. Abbreviation: LC-like cells, Langerhans cell-like cells. f tSNE plot of human T cells (dots), color-coded by cluster (top panel). Heatmaps of single cells (bottom left panel) and averaged single cells (bottom right panel) represent the mRNA expression levels of well-known markers of T cell subtypes

