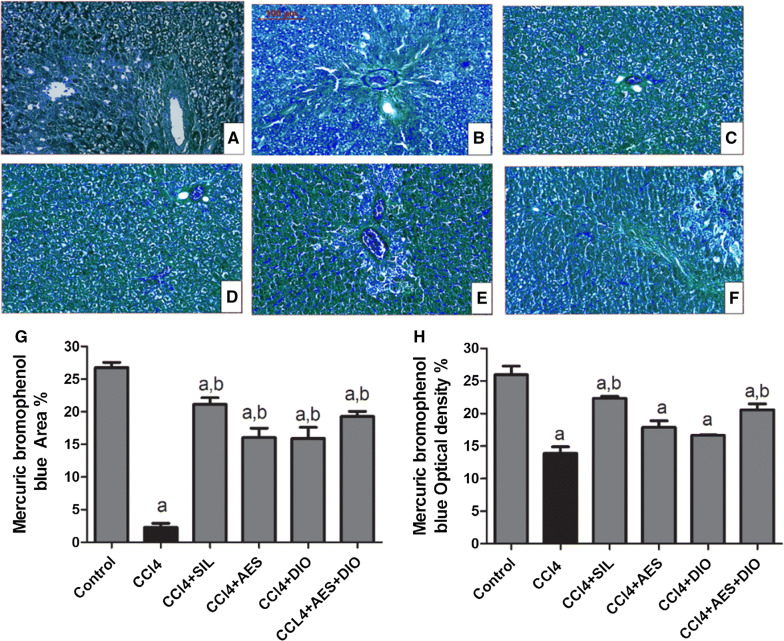
Fig. 3.
Effects of AES and DIO each alone or in low-dose combination on the distribution of protein contents in liver tissue stained by Mercuric bromophenol blue reagent in the CCl4-induced liver rat model. A–F Representative images of mercuric bromophenol blue staining (blue area), 200 × magnification, scale bar equals 500 µm. Mercuric bromophenol blue-positive area expression % (G) and optical density % (H) across10 different fields for each rat section using Leica Qwin 500 Image Analyzer. Data are presented as mean ± SEM (n = 6/group). a P < 0.05 vs. control group. b P < 0.05 vs. CCl4 group

