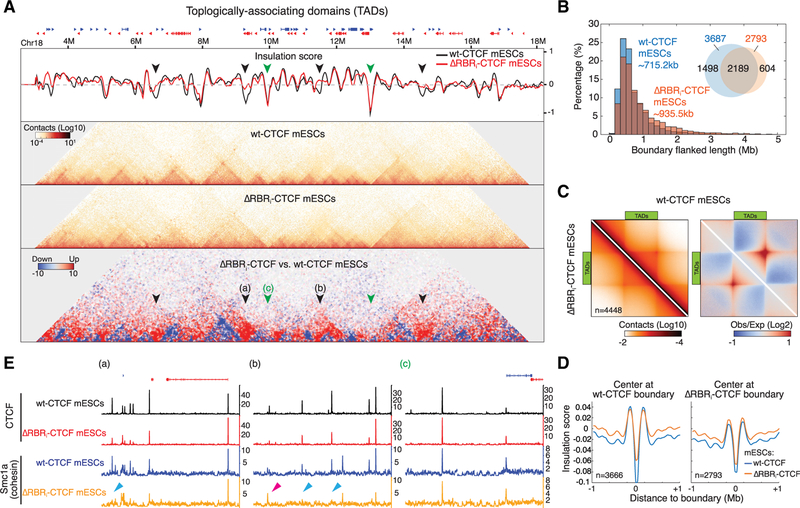
Figure 4. TAD Organization Is Changed in ΔRBRi-CTCF mESCs.
(A) Example of TAD boundary disruption in ΔRBRi-CTCF mESCs. Snapshot of insulation score curves, 45°-rotated contact maps, and differential contact matrix (from top to bottom) plotted for Chr18: 3M–18M. Insulation scores were calculated using a 200 kb sliding window at 20 kb resolution. A lower value of insulation score means stronger insulation strength. Black arrows: examples of loss of insulation in ΔRBRi-CTCF mESCs. Green arrows: unaffected insulators. Differential contact matrices were generated by subtraction of the normalized ΔRBRi-CTCF matrix to WT-CTCF matrix. Blue indicates weaker TADs in ΔRBRi-CTCF mESCs. Red indicates “bleed-through,” that is, loss of TAD insulation (black arrows).
(B) Size distribution of TADs (boundary or insulator-flanked regions). Inset: Venn diagram. ΔRBRi-CTCF mESCs lose 1,474 of 3,666 insulators identified in WT-CTCF mESCs.
(C) Aggregate peak analysis for TADs. TADs in WT-CTCF mESCs were identified through an additional TAD calling algorithm (arrowhead) and rescaled and aggregated (n = 4,448) at the center of the plot with ICE normalization (left) or distance normalization (right). WT-CTCF is shown on the top half and ΔRBRi-CTCF is shown on the bottom half.
(D) Genome-wide averaged insulation plotted versus distance around insulation center. Insulation strength is weaker in ΔRBRi-CTCF mESCs when centering at WT insulators, but there is no significant change when centering at ΔRBRi-CTCF insulators.
(E) Browser tracks. Snapshot regions (~200 kb) around the arrows (a, b, and c) indicated in are shown with CTCF and cohesin (Smc1a) ChIP-seq data. (a) and (b) display regions with strong depletion of insulation in ΔRBRi-CTCF mESCs, and (c) shows a region with little effect. The blue arrows indicate examples for loss of Smc1a peaks in ΔRBRi-CTCF mESCs, and the pink arrow indicates an example for gain or shift of Smc1a peak.
See also Figures S2–S6.

