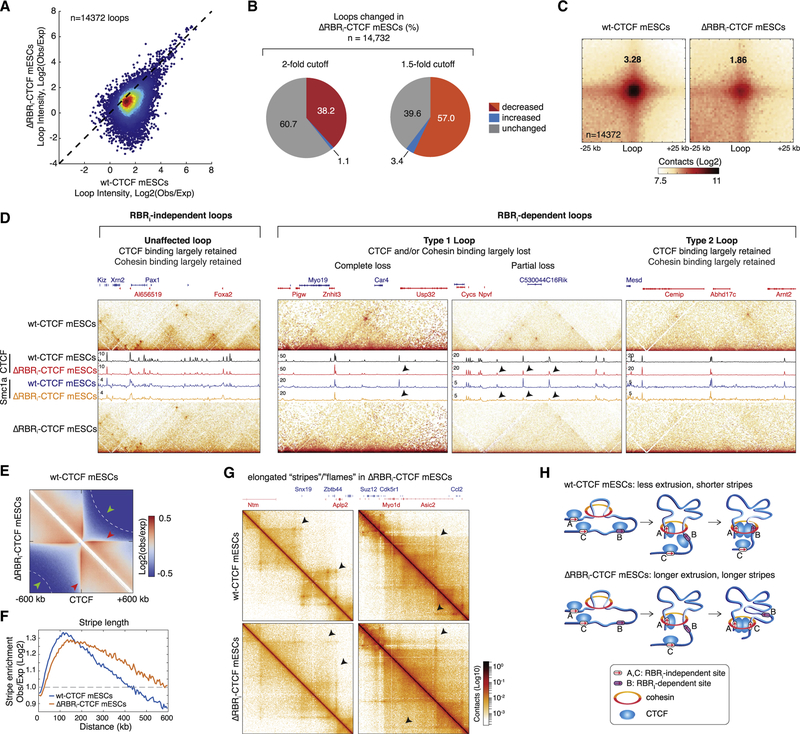
Figure 5. Genome Organization at the Level of Both Loops and Stripes Is Altered in ΔRBRi-CTCF mESCs.
(A) Scatterplot showing individual loop intensities in WT-CTCF versus ΔRBRi-CTCF mESCs. A total of 14,372 loops were identified in WT-CTCF mESCs, with a false discovery rate < 0.1. Loop intensity was calculated as log2 enrichment of center pixel over expected bottom left pixels at 1, 5, or 10 kb resolution.
(B) Pie charts showing affected loops. Approximately 8,189 loops are decreased by at least 1.5-fold, and 5,490 loops are decreased by at least 2-fold in ΔRBRi-CTCF compared with WT-CTCF mESCs.
(C) Aggregate peak analysis for loops. The called loops were aggregated at the center of a 50 kb window at 1 kb resolution. The genome-wide averaged loop enrichment was calculated by the fold enrichment (center pixel/expected bottom left pixels).
(D) Snapshots of four representative genomic regions of different CTCF loop types. Zoomed-in contact maps were plotted on the top and bottom panels forWT-CTCF and ΔRBRi-CTCF mESCs, respectively. CTCF and cohesin (Smc1a) ChIP-seq data are overlaid. From left to right, examples are shown of RBRi-independent loops and of the two sub-types of RBRi-dependent loops (with two examples of partial and complete loss of CTCF and cohesin binding for loop type 1).
(E) Aggregation plot centered at top CTCF peaks. The contact matrices were aggregated around the top 10,000 CTCF ChIP-seq peaks using a ±600 kb window. WT-CTCF mESCs are shown on the top half of the plot, and ΔRBRi-CTCF mESCs are shown on the bottom half. Red arrows indicate stripes or flames. Green arrows and white dashed lines indicate insulation strength.
(F) Quantification of stripe length. Stripes enrichments were calculated in log2 ratio of observed over expected contacts. Significant enrichment was defined as 2fold enrichment labeled shown as a gray dashed line in the plot.
(G) Representative contact maps at specific regions showing elongated “stripes” or “flames” in ΔRBRi-CTCF mESCs.
(H) Loop extrusion sketch. Speculative illustration of why loss of a subset of CTCF boundaries might result in longer stripes assuming loop extrusion (Fudenberg et al., 2017).
See also Figures S4 and S6.

