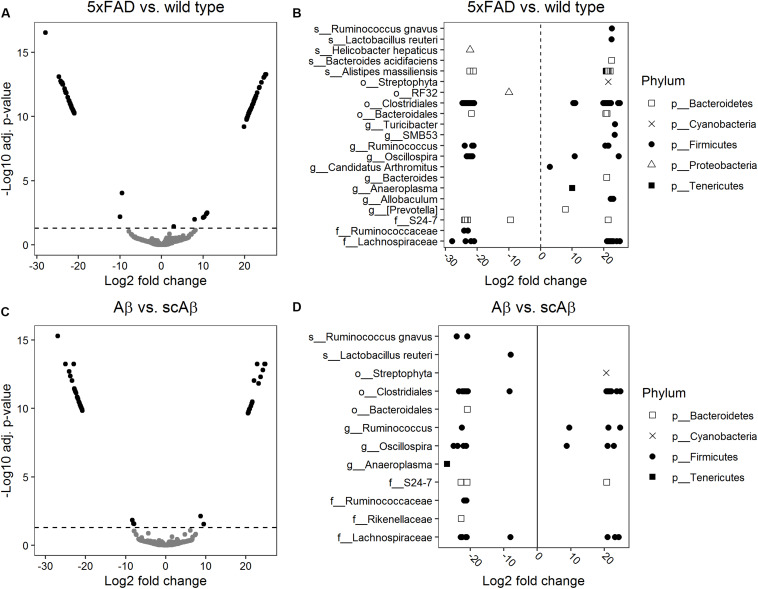
FIGURE 5.
Differential abundance analysis of bacterial operational taxonomic units (OTUs). Log2 fold changes of bacterial abundance were calculated using DESeq2. Volcano plots show the log2 fold changes versus –log10 adjusted p-values for 5xFAD relative to wild type mice (A) and animals fed with Aβ relative to mice receiving the scrambled peptide (C). OTUs were considered to be differentially abundant if the adjusted p-value (Benjamini–Hochberg method) was below 0.05 (indicated by a dashed horizontal line). Significant log2 fold changes appear as black dots in panels (A) and (C). The lowest level of taxonomy which could be assigned to the differentially abundant OTUs is depicted in panel (B) for 5xFAD mice relative to wild type littermates and in panel (D) for mice fed with Aβ relative to the scrambled peptide control group. Log2 fold changes greater than 0 correspond to OTUs significantly enriched in 5xFAD or Aβ-fed mice relative to the respective control group.

