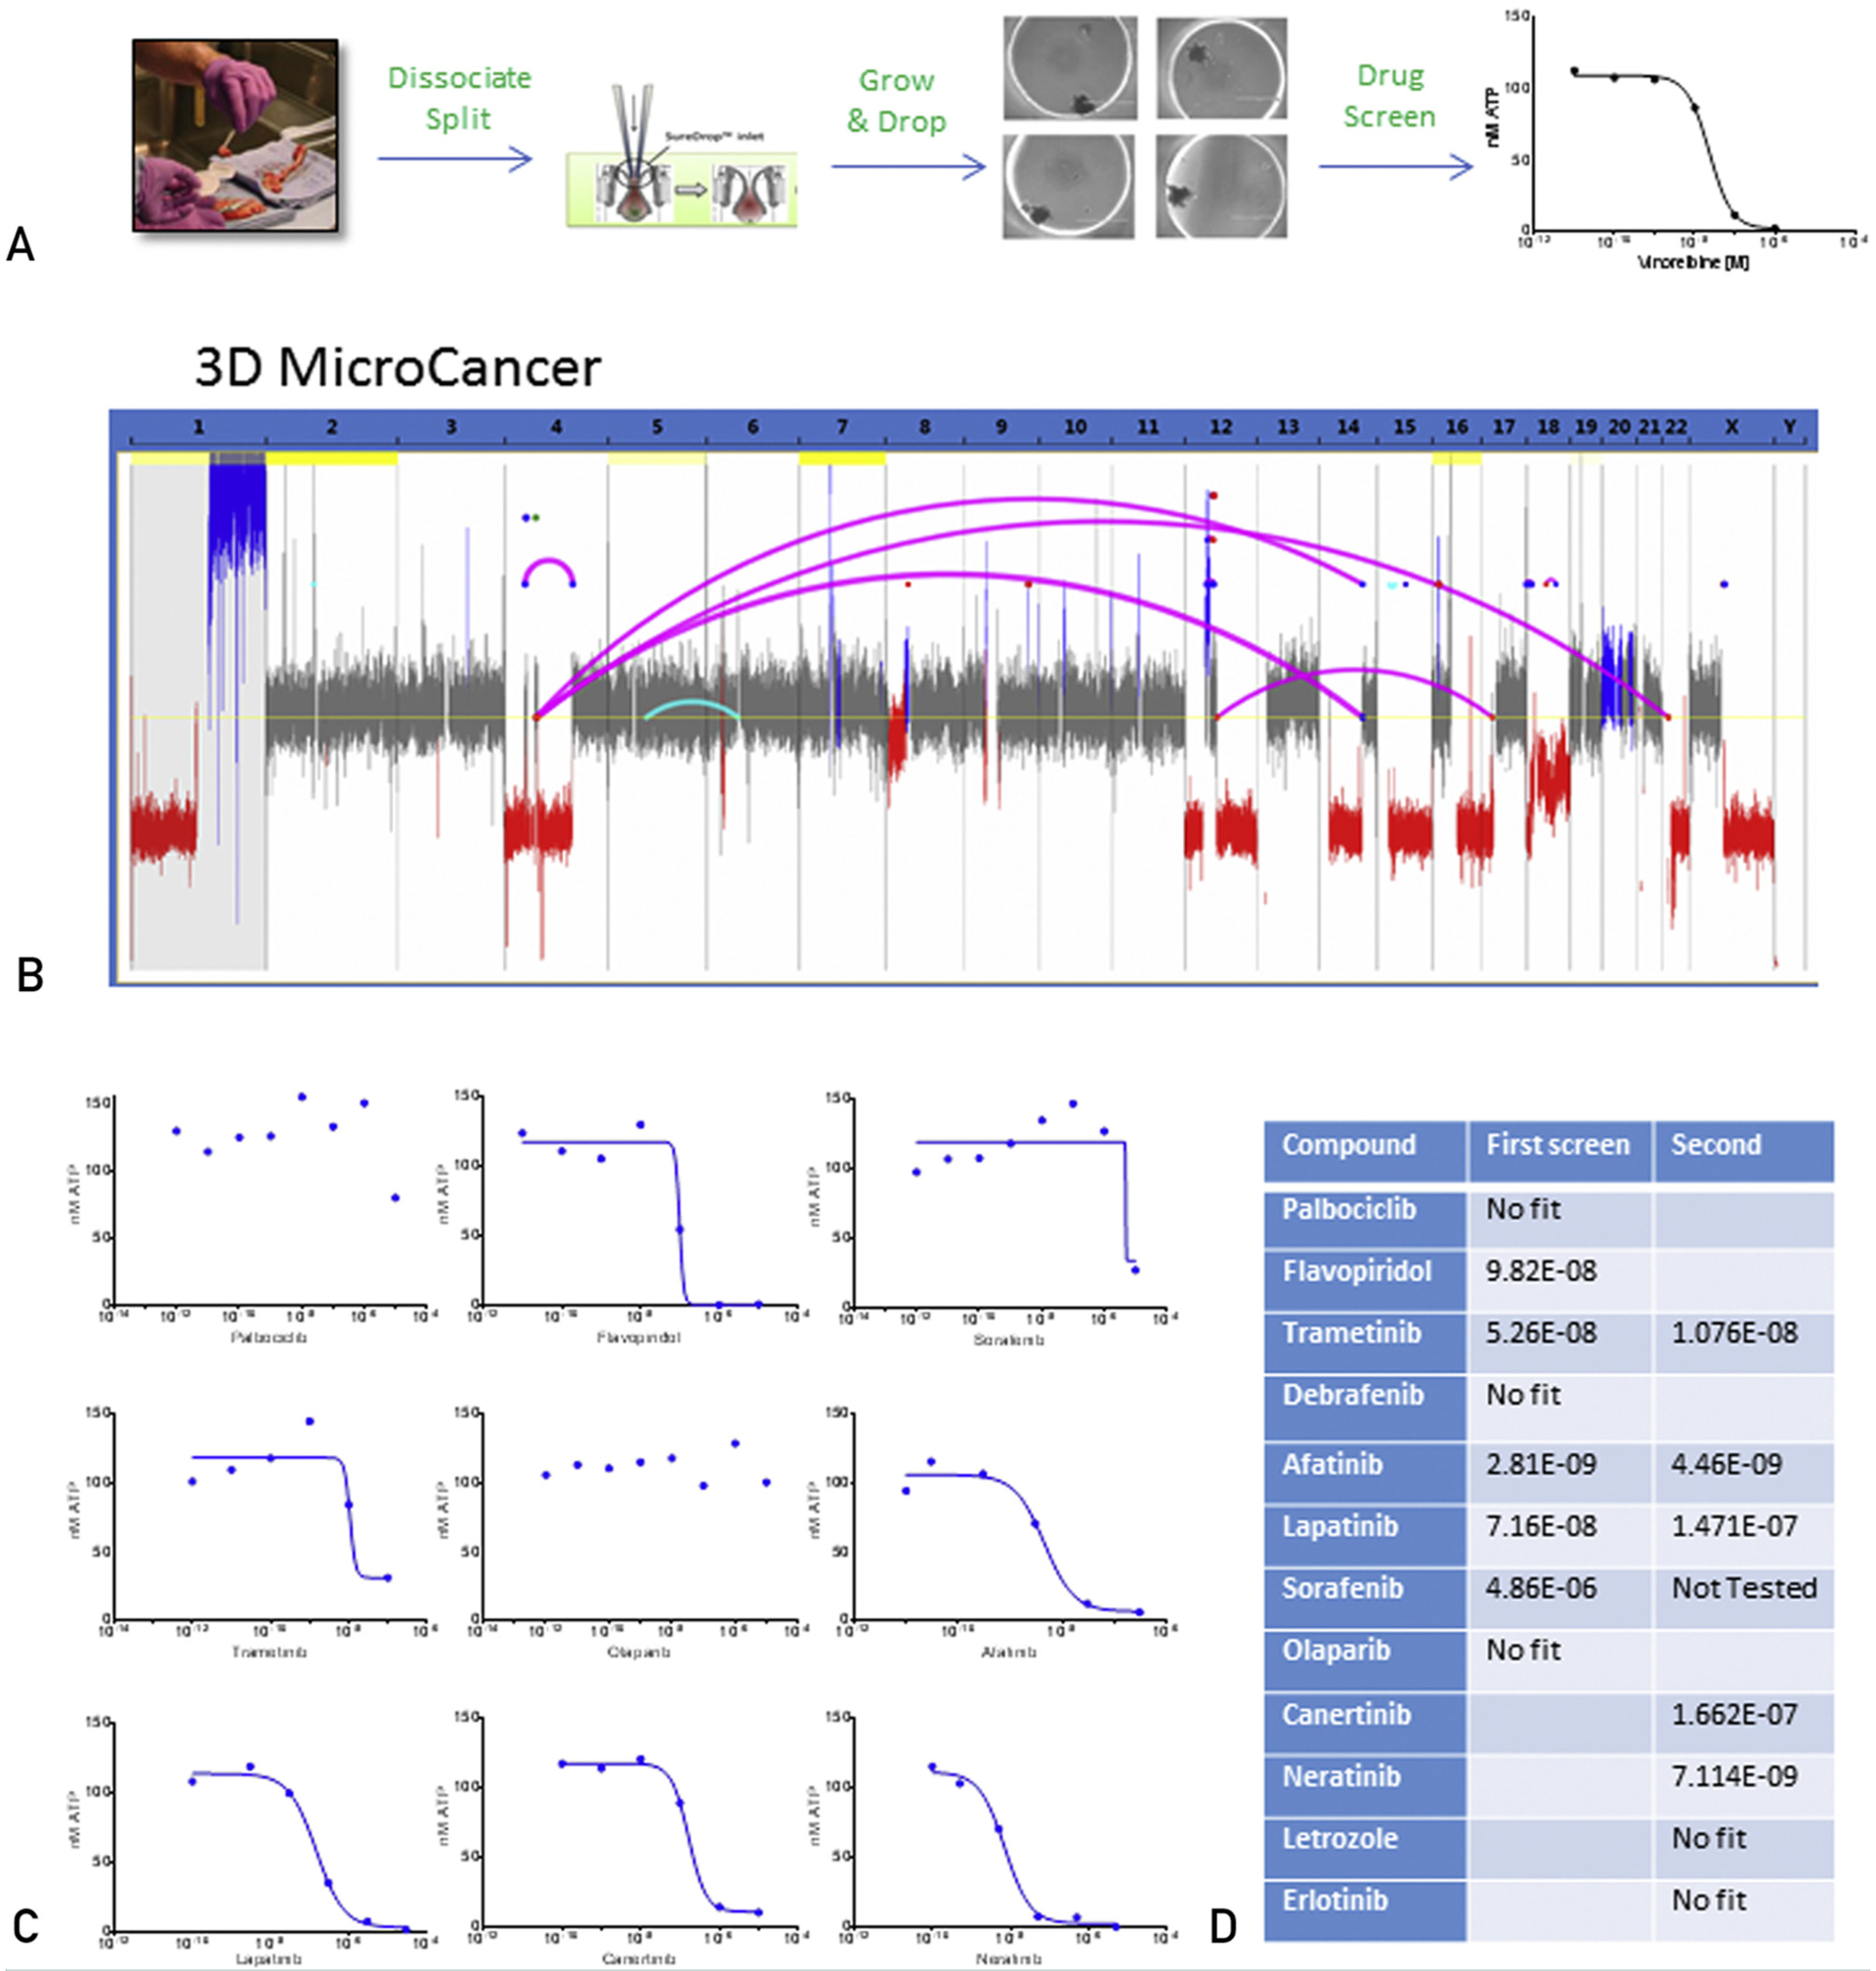
FIGURE 4.

Summary of 3-dimensional (3D) microcancer data. (A) Schematic of the overall microcancer experimental process. (B) Whole-genome linear plot representation depicting structural variants and aneuploidy in the 3D microcancer of the breast cancer liver metastasis. (C) Dose response curves of the breast cancer liver metastasis 3D microcancer to indicated therapies. Y axis is adenosine triphosphate in nM, a measure of cell viability, whereas x axis is drug concentration (M). (D) Table of tested compounds and the related inhibitory concentrations at 50% obtained after testing the breast cancer liver metastasis 3D microcancers.
