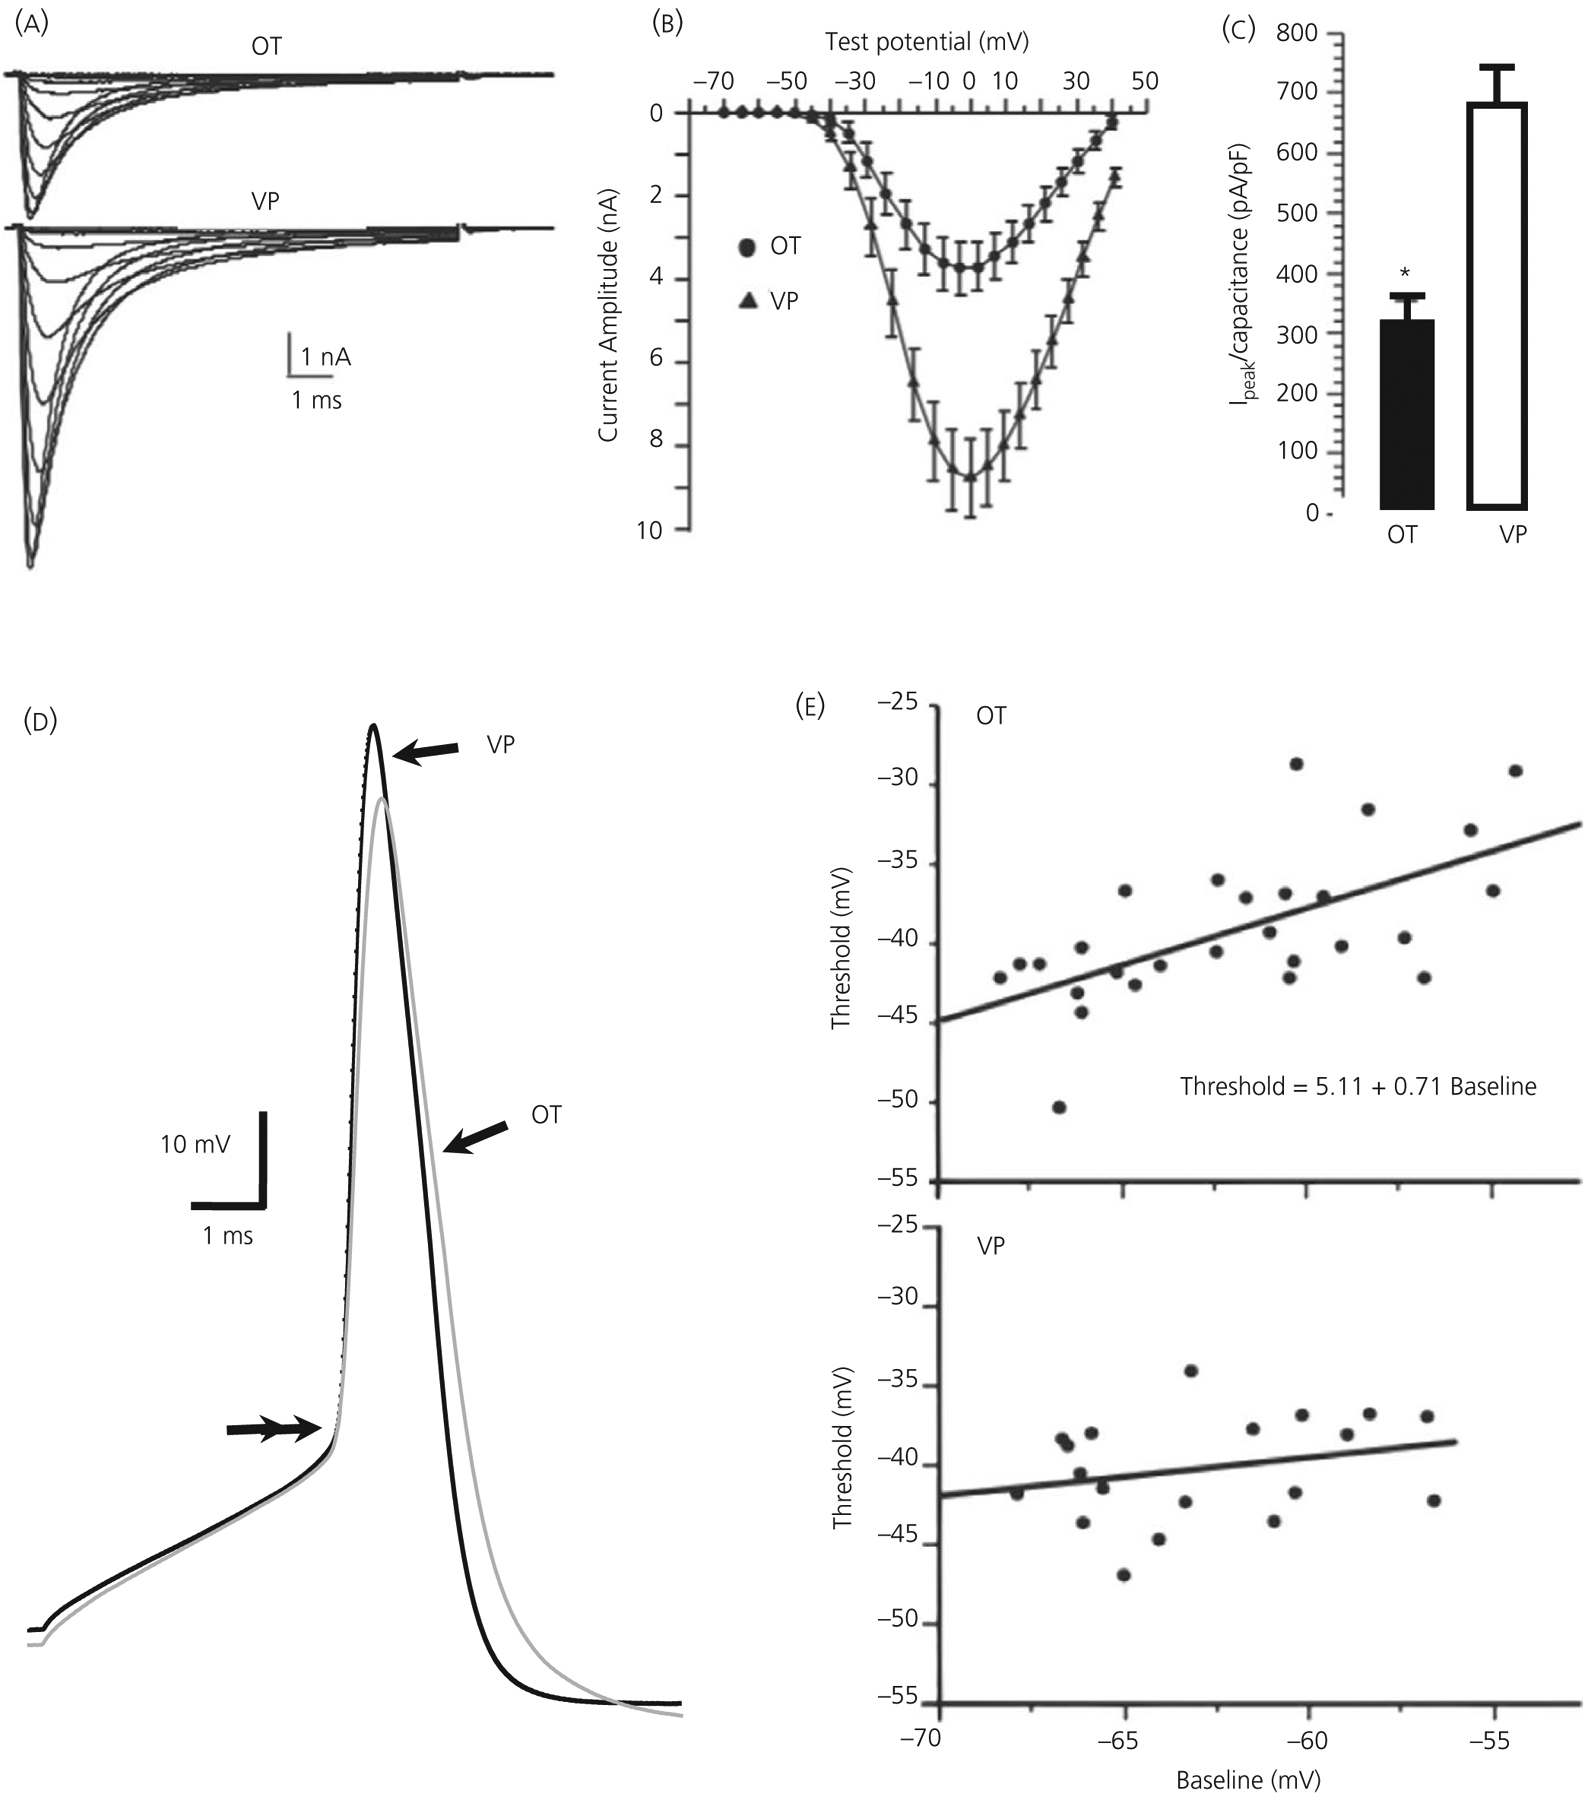
FIGURE 2.

Transient voltage-dependent Na+ (INa+) currents in dissociated, immunopositive vasopressin (VP) and oxytocin (OT) neurones. A, Averaged INa+ records from 13 OT and 20 VP neurones showing voltage dependence of activation (steps to −55 through −5 mV from −90 mV). B, Plots of peak amplitude ( ± SEM) vs voltage from neurones shown in (A). C, Bar graph illustrating difference in peak current density ( ± SEM) for these OT and VP neurones, *P ≤ 0.05. D, Action potentials (APs) from OT (grey trace) and VP neurones (black trace) aligned at threshold (double arrows). Note the slower rise of the OT compared to the AP of the VP neurone, and its smaller amplitude. E, Spike threshold plotted against baseline membrane potential (Vm) in OT and VP neurones. Top: in OT neurones, threshold was positively correlated with Vm. Bottom: in VP neurones, no significant correlation was found. Modified from Scroggs et al49
