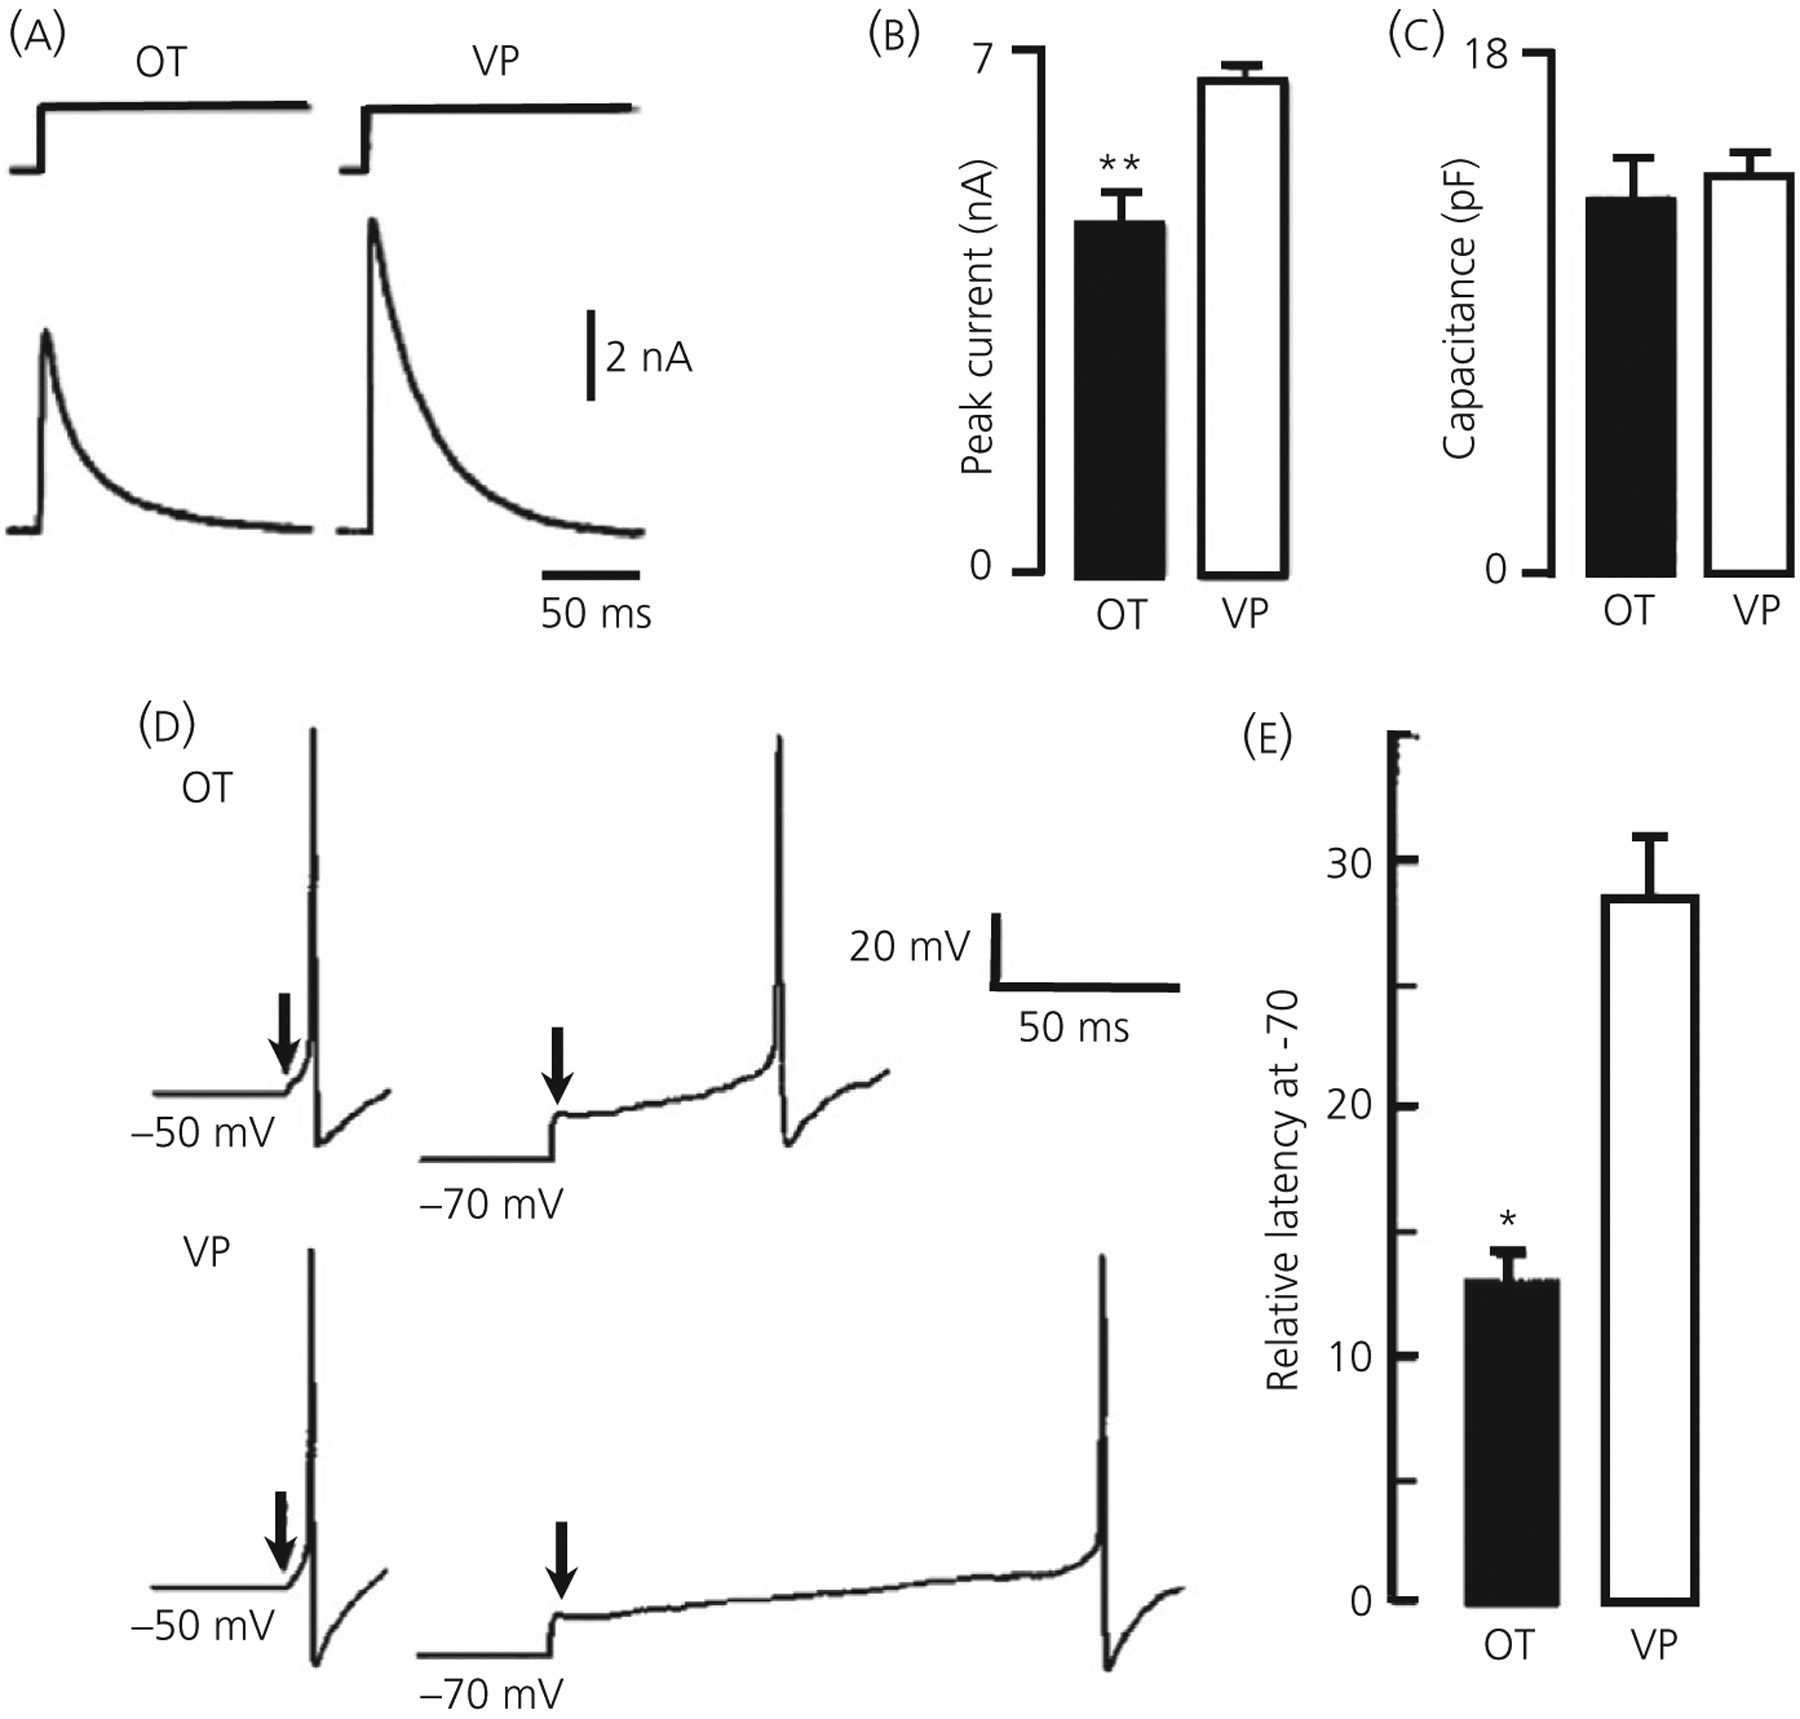
FIGURE 4.

Transient K+ current (IA) is greater in vasopressin (VP) neurones. A, IA evoked with 500-ms pulse from −130 to −10 mV in an oxytocin (OT) and VP neurone under voltage clamp. B, Bar graph illustrating differences in peak current for 18 OT and 52 VP neurones ( ± SEM), ** P ≤ 0.001. C, The whole cell capacitance is not different in these cells, indicating a larger current density in VP neurones. D, Current clamp recording showing the latency to excitation with a depolarising pulse in OT and VP neurones from holding potentials of −50 mV vs −70 mV. The time between the arrows and the action potential is the latency. E, bar histograms showing the mean ± SEM latency to excitation following release from −70 mV expressed relative to that at 50 mV. Note that the relative latency in OT neurones is <50% of that in VP neurones (*P < 0.01). Modified from Fisher et al47
