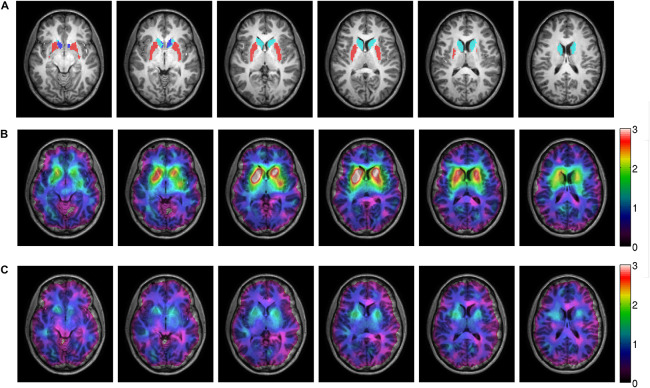
FIGURE 1.
MRI and SPECT images of one patient, treated with 300 mg amisulpride displaying a mean dopamine D2 receptor occupancy of 56%. Panel (A) shows the sMRI image with the caudate nucleus (light blue), putamen (red) and accumbens (dark blue) from the subcortical Harvard-Oxford atlas depicted. Panels (B,C) show the co-registered SPECT image on top of the MRI image. The color scale corresponds to the specific binding potential before treatment (B) and after six weeks of treatment (C).

