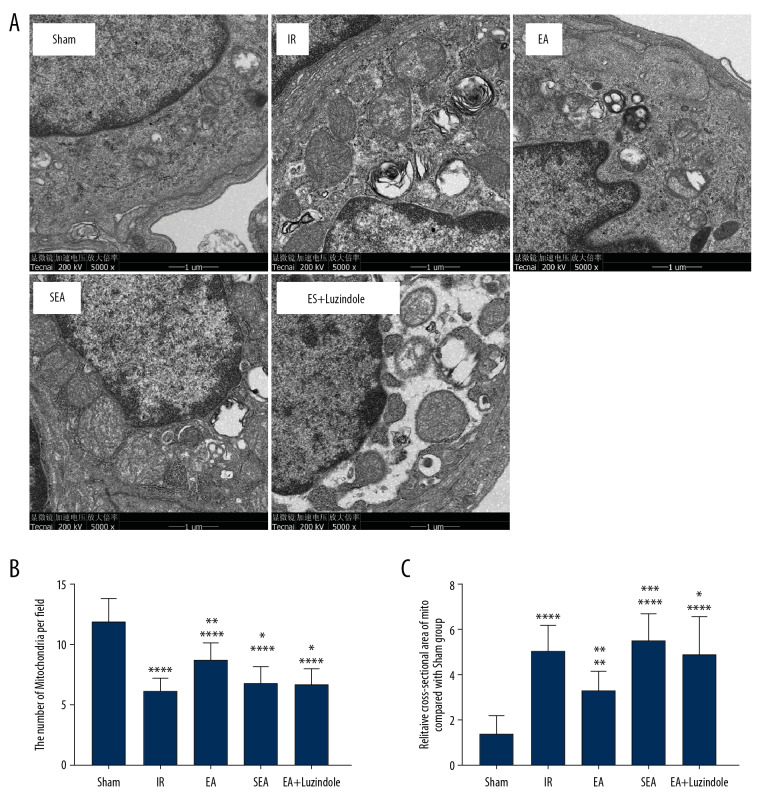
Figure 2.
The results of transmission electron microscopy of lung tissue in different groups. (A) Transmission electron microscopy of lung tissue in different groups. (B, C) Quantitative analysis of changes in mitochondrial number and cross-sectional area. All data are mean±SEM (n=10), compared with the Sham group, **** P<0.0001,** P<0.01; compared with the IR group, ** P<0.01; compared with the EA group,*** P<0.001, * P<0.05. SEM – standard error of the mean; IR – model group; EA – electroacupuncture.

