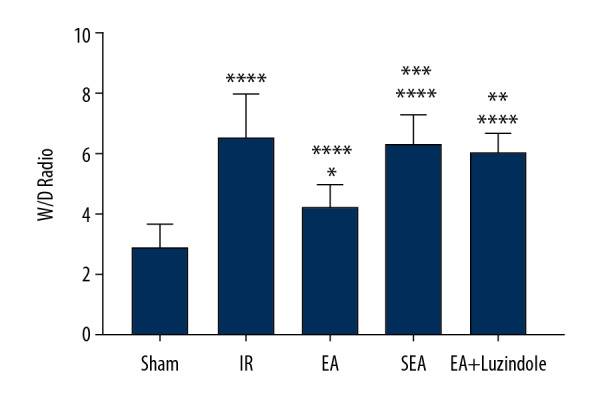
Figure 3.

Changes of W/D values in different groups. All data are mean±SEM (n=10), compared with the Sham group, **** P<0.0001, * P<0.05; compared with the IR group, **** P<0.0001; compared with the EA group,*** P<0.001, ** P<0.01. W/D – wet weight/dry weight; SEM – standard error of the mean.
