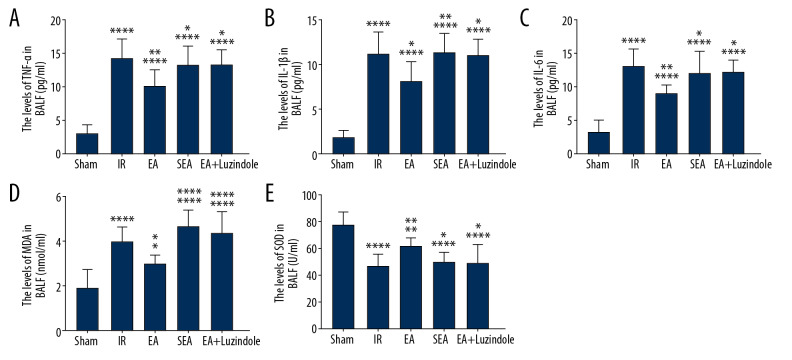
Figure 4.
Changes of inflammatory factors and oxidative stress in different groups. (A–C) TNF-α, IL-1β, and IL-6 levels in different groups, compared with the Sham group, **** P<0.0001; compared with the IR group,** P<0.01, * P<0.05; compared with EA group, * P<0.05, ** P<0.01. (D, E) MDA content and SOD activity in different groups, compared with Sham group, **** P<0.0001, ** P<0.01, * P<0.05; compared with the IR group, ** P<0.01, * P<0.05; compared with the EA group, * P<0.05, **** P<0.0001. All data are mean±SEM (n=10). TNF – tumor necrosis factor; IL – interleukin; IR – model group; MDA – malondialdehyde; SOD – superoxide dismutase; SEM – standard error of the mean.

