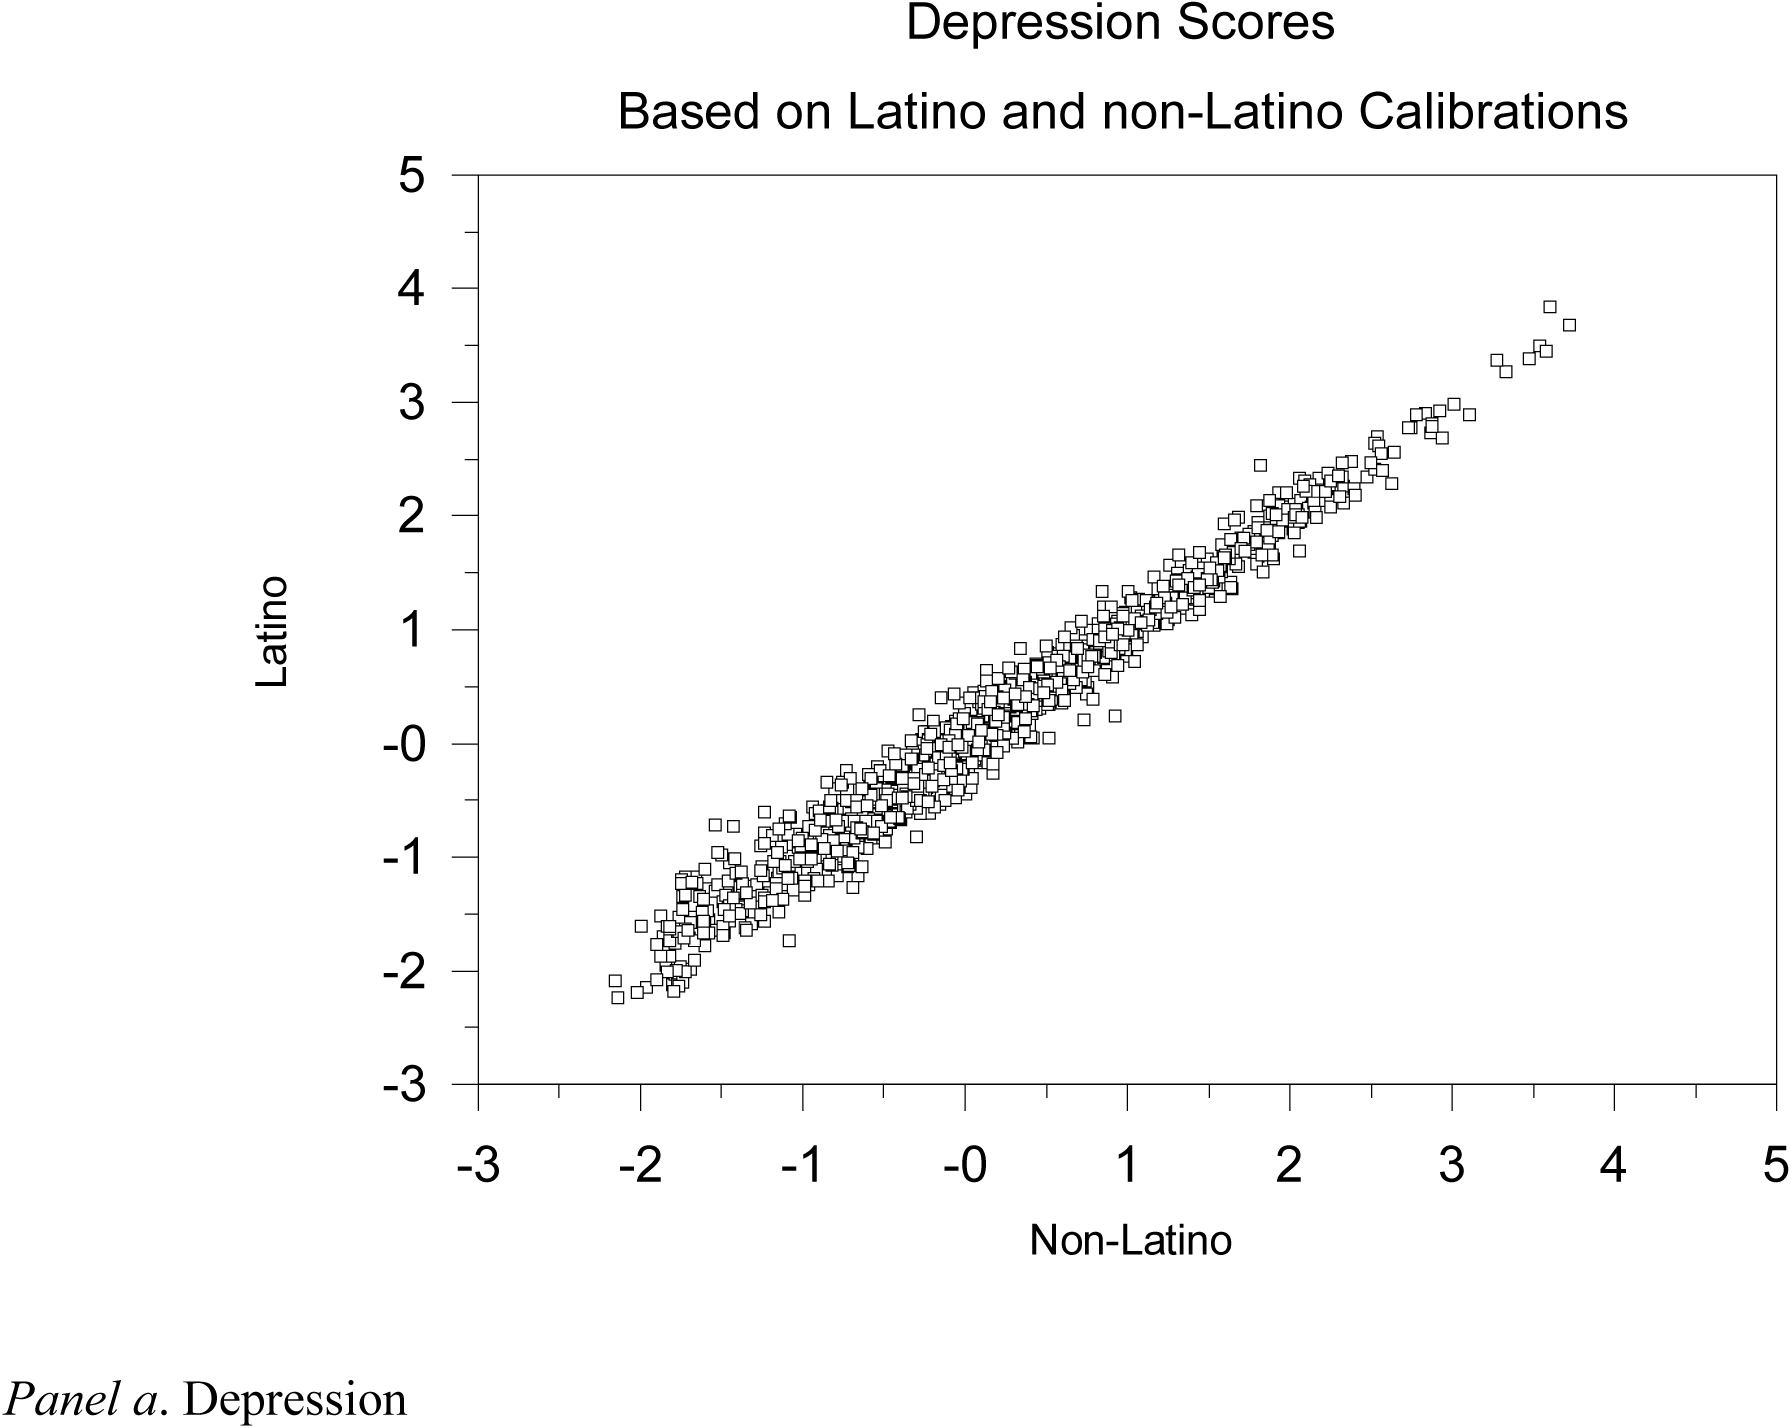
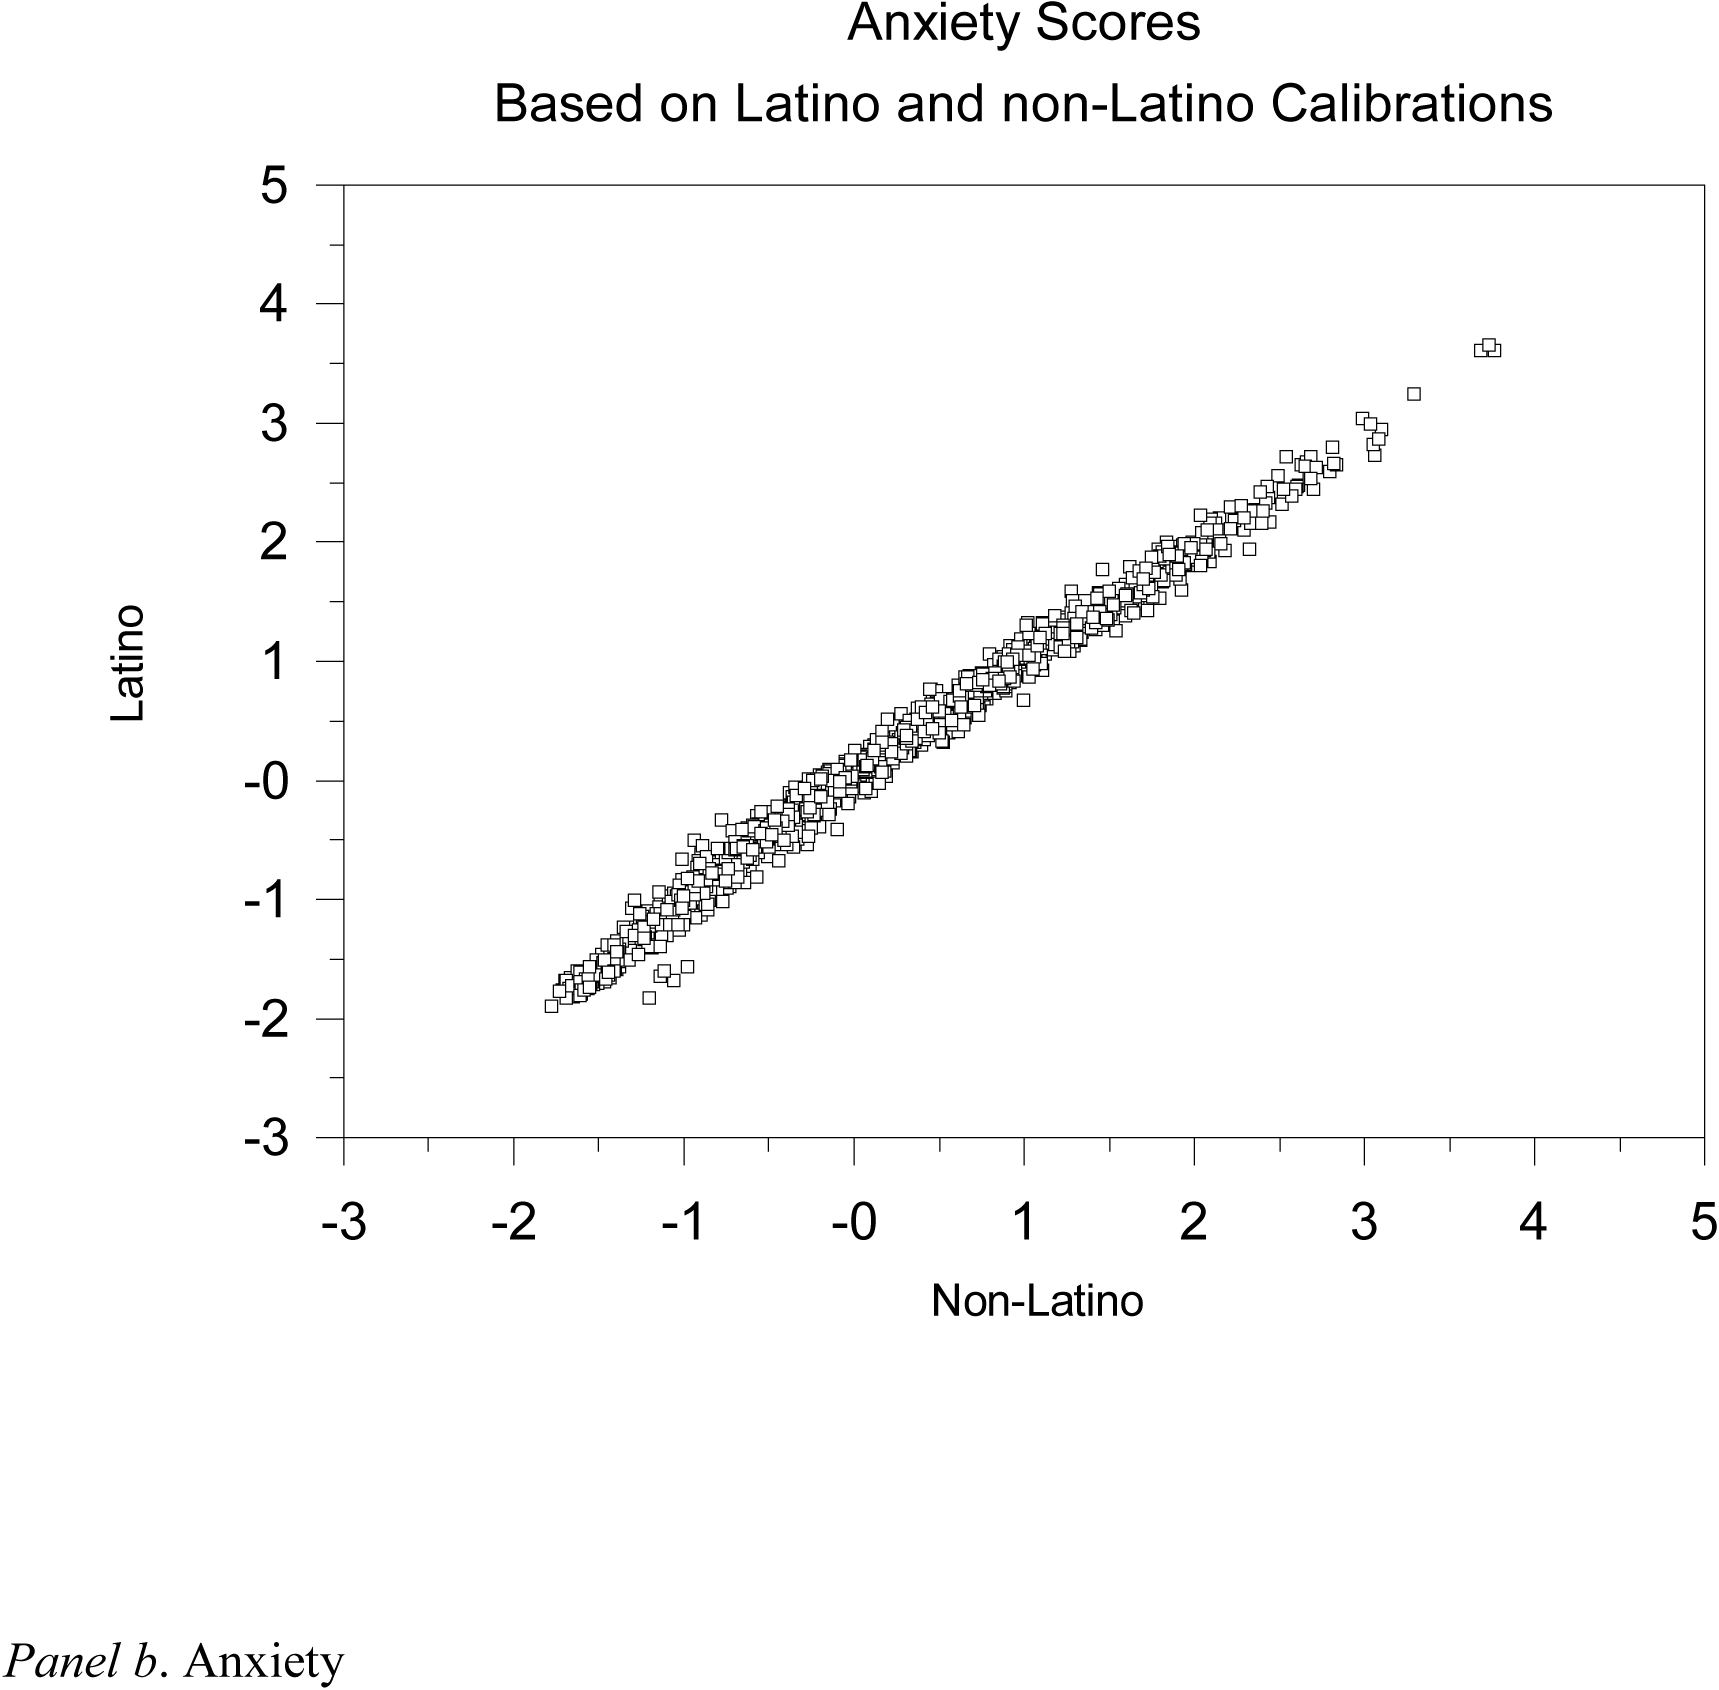
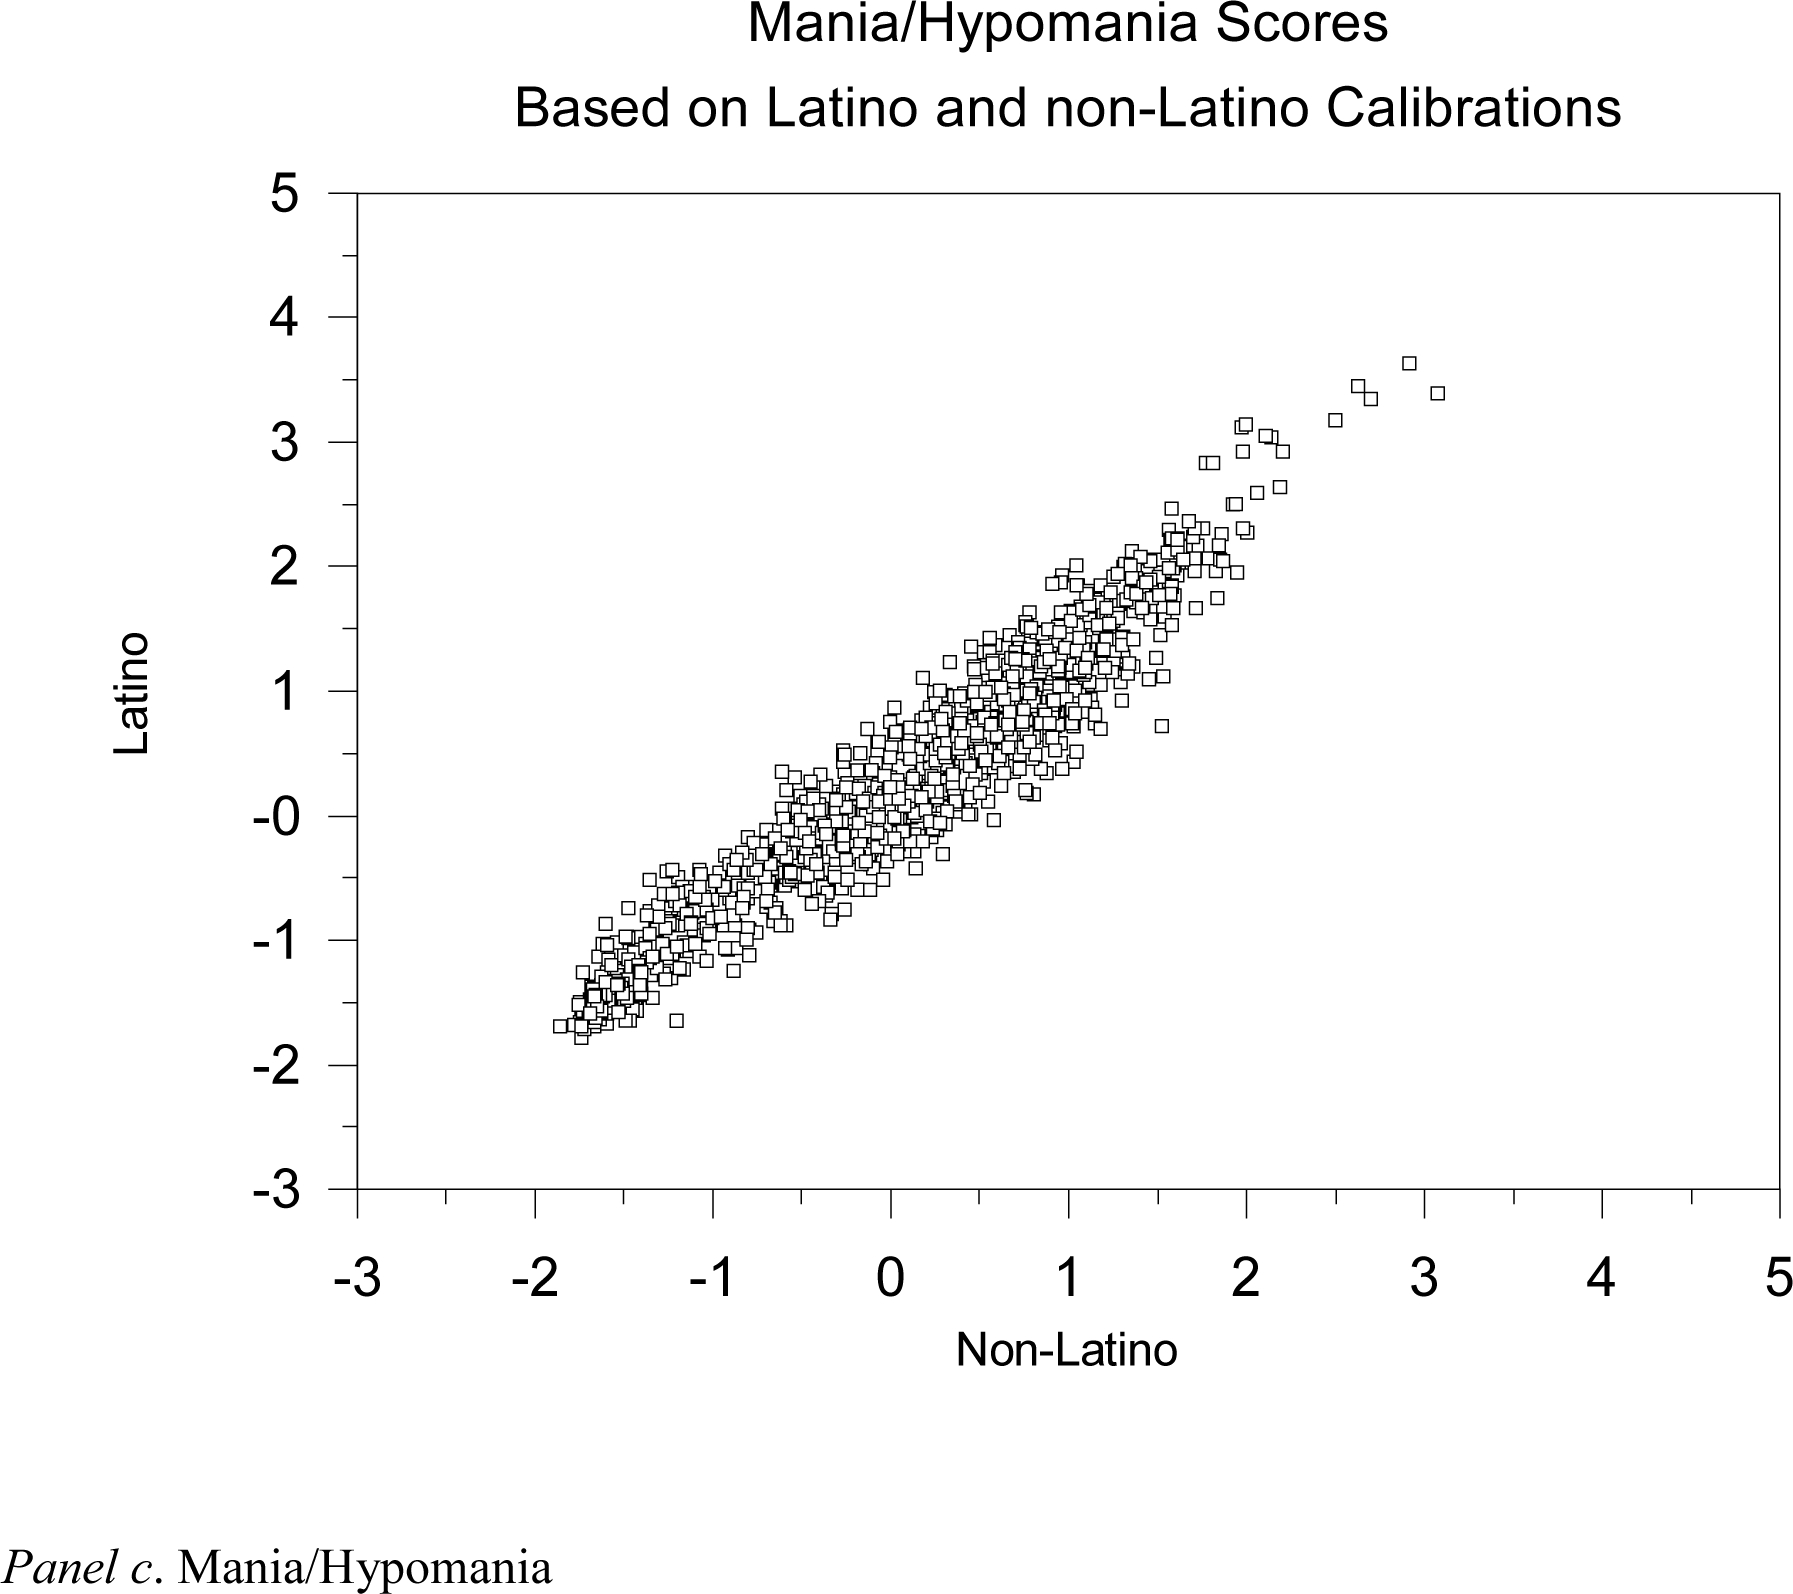
Figure 1.


Bivariate relationship between the estimated primary severity scores based on the original non-Latino calibration and the new Latino calibration after eliminating poor discriminating items. X-axis refers to the primary severity score estimate based on the original non-Latino calibration. Y-axis refers to the primary severity score estimate based on the Latino calibration. The scale is the underlying N(0,1) distribution of the test scores produced by the bifactor model.
