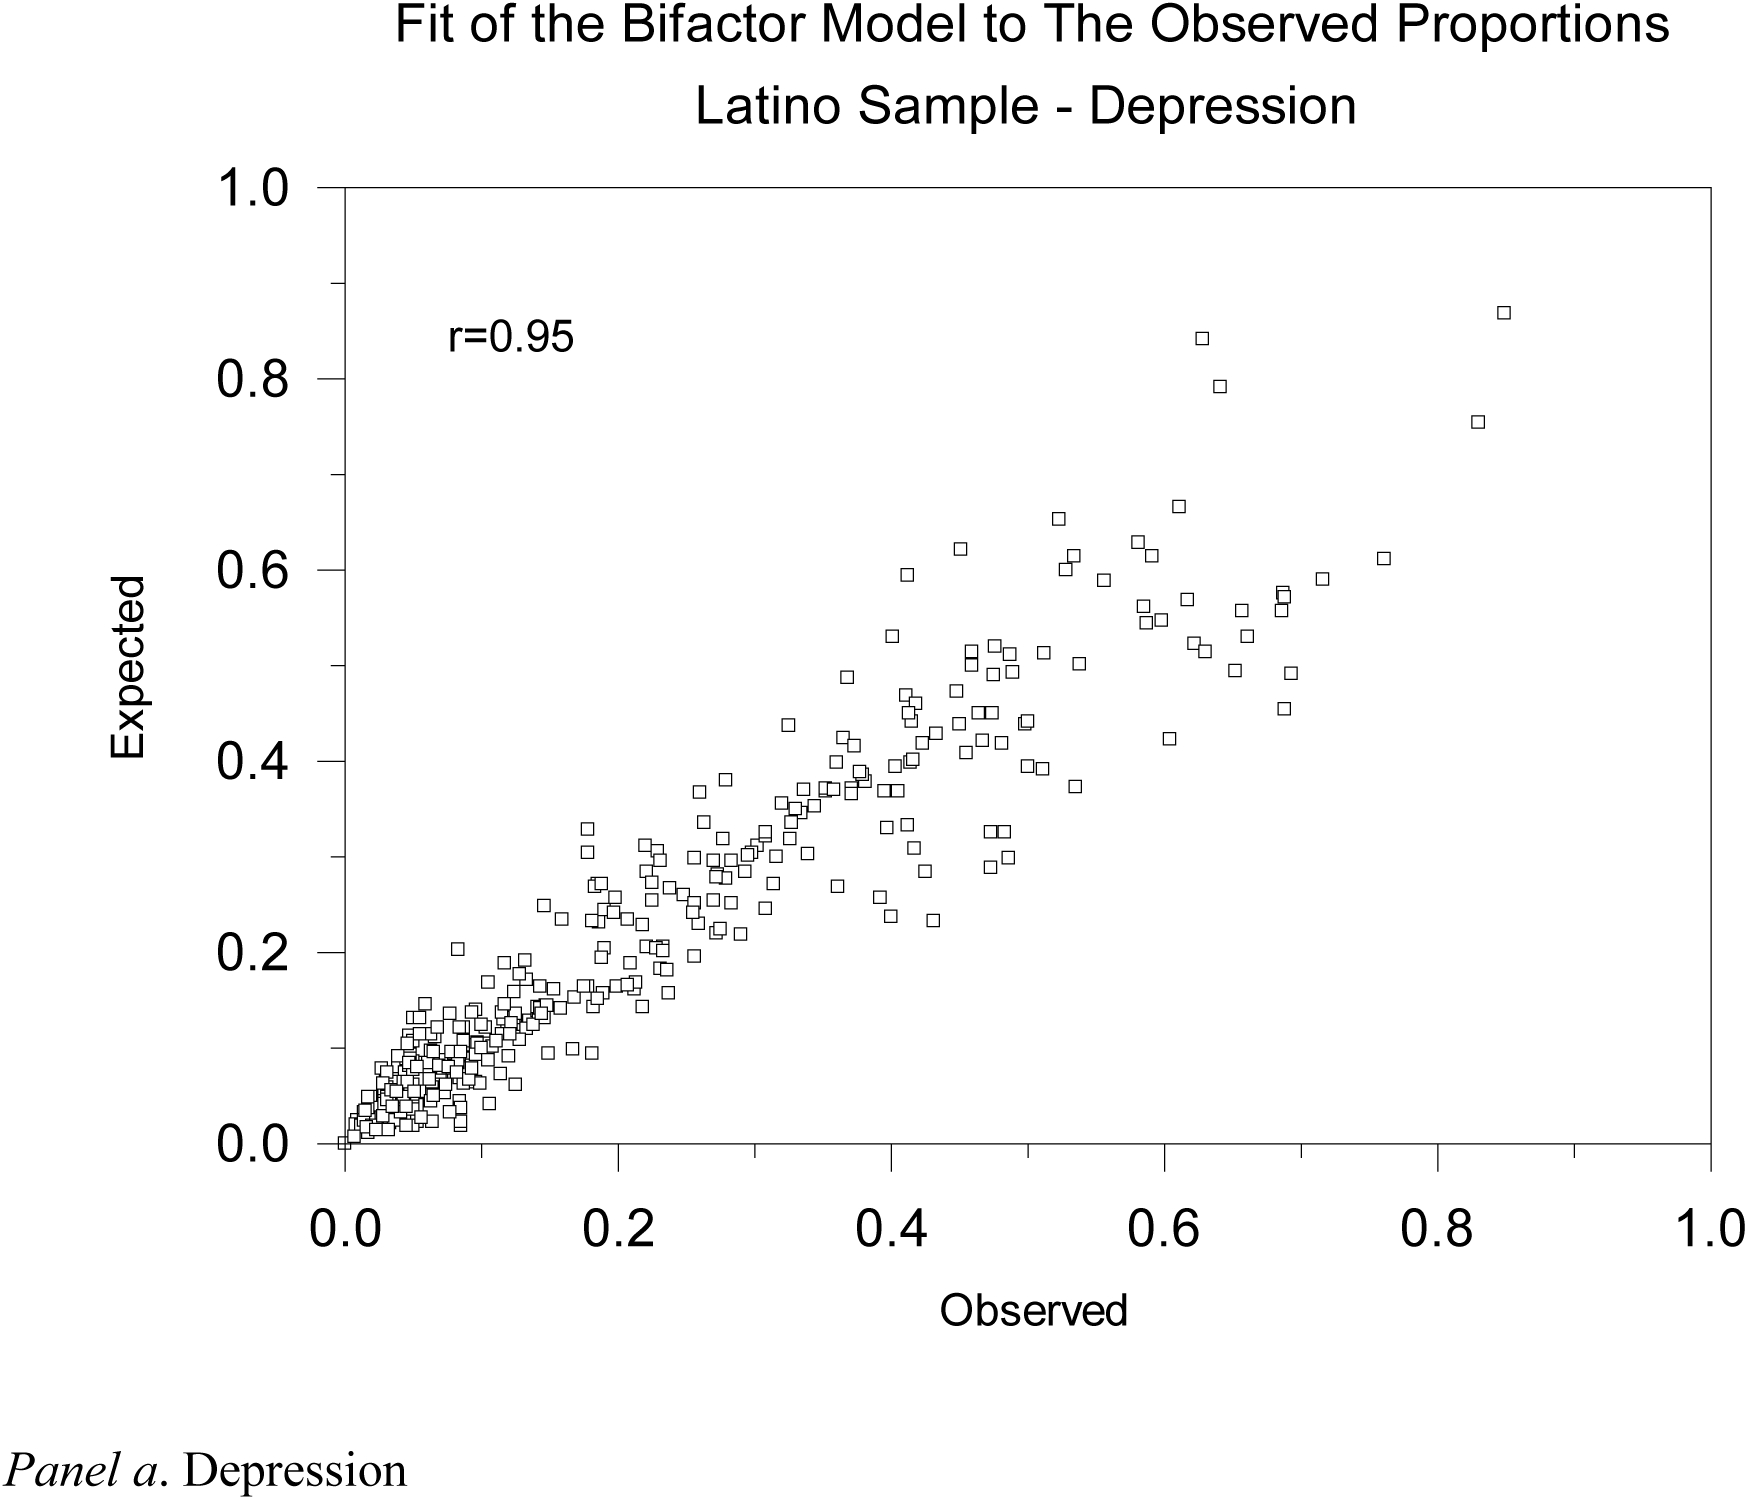
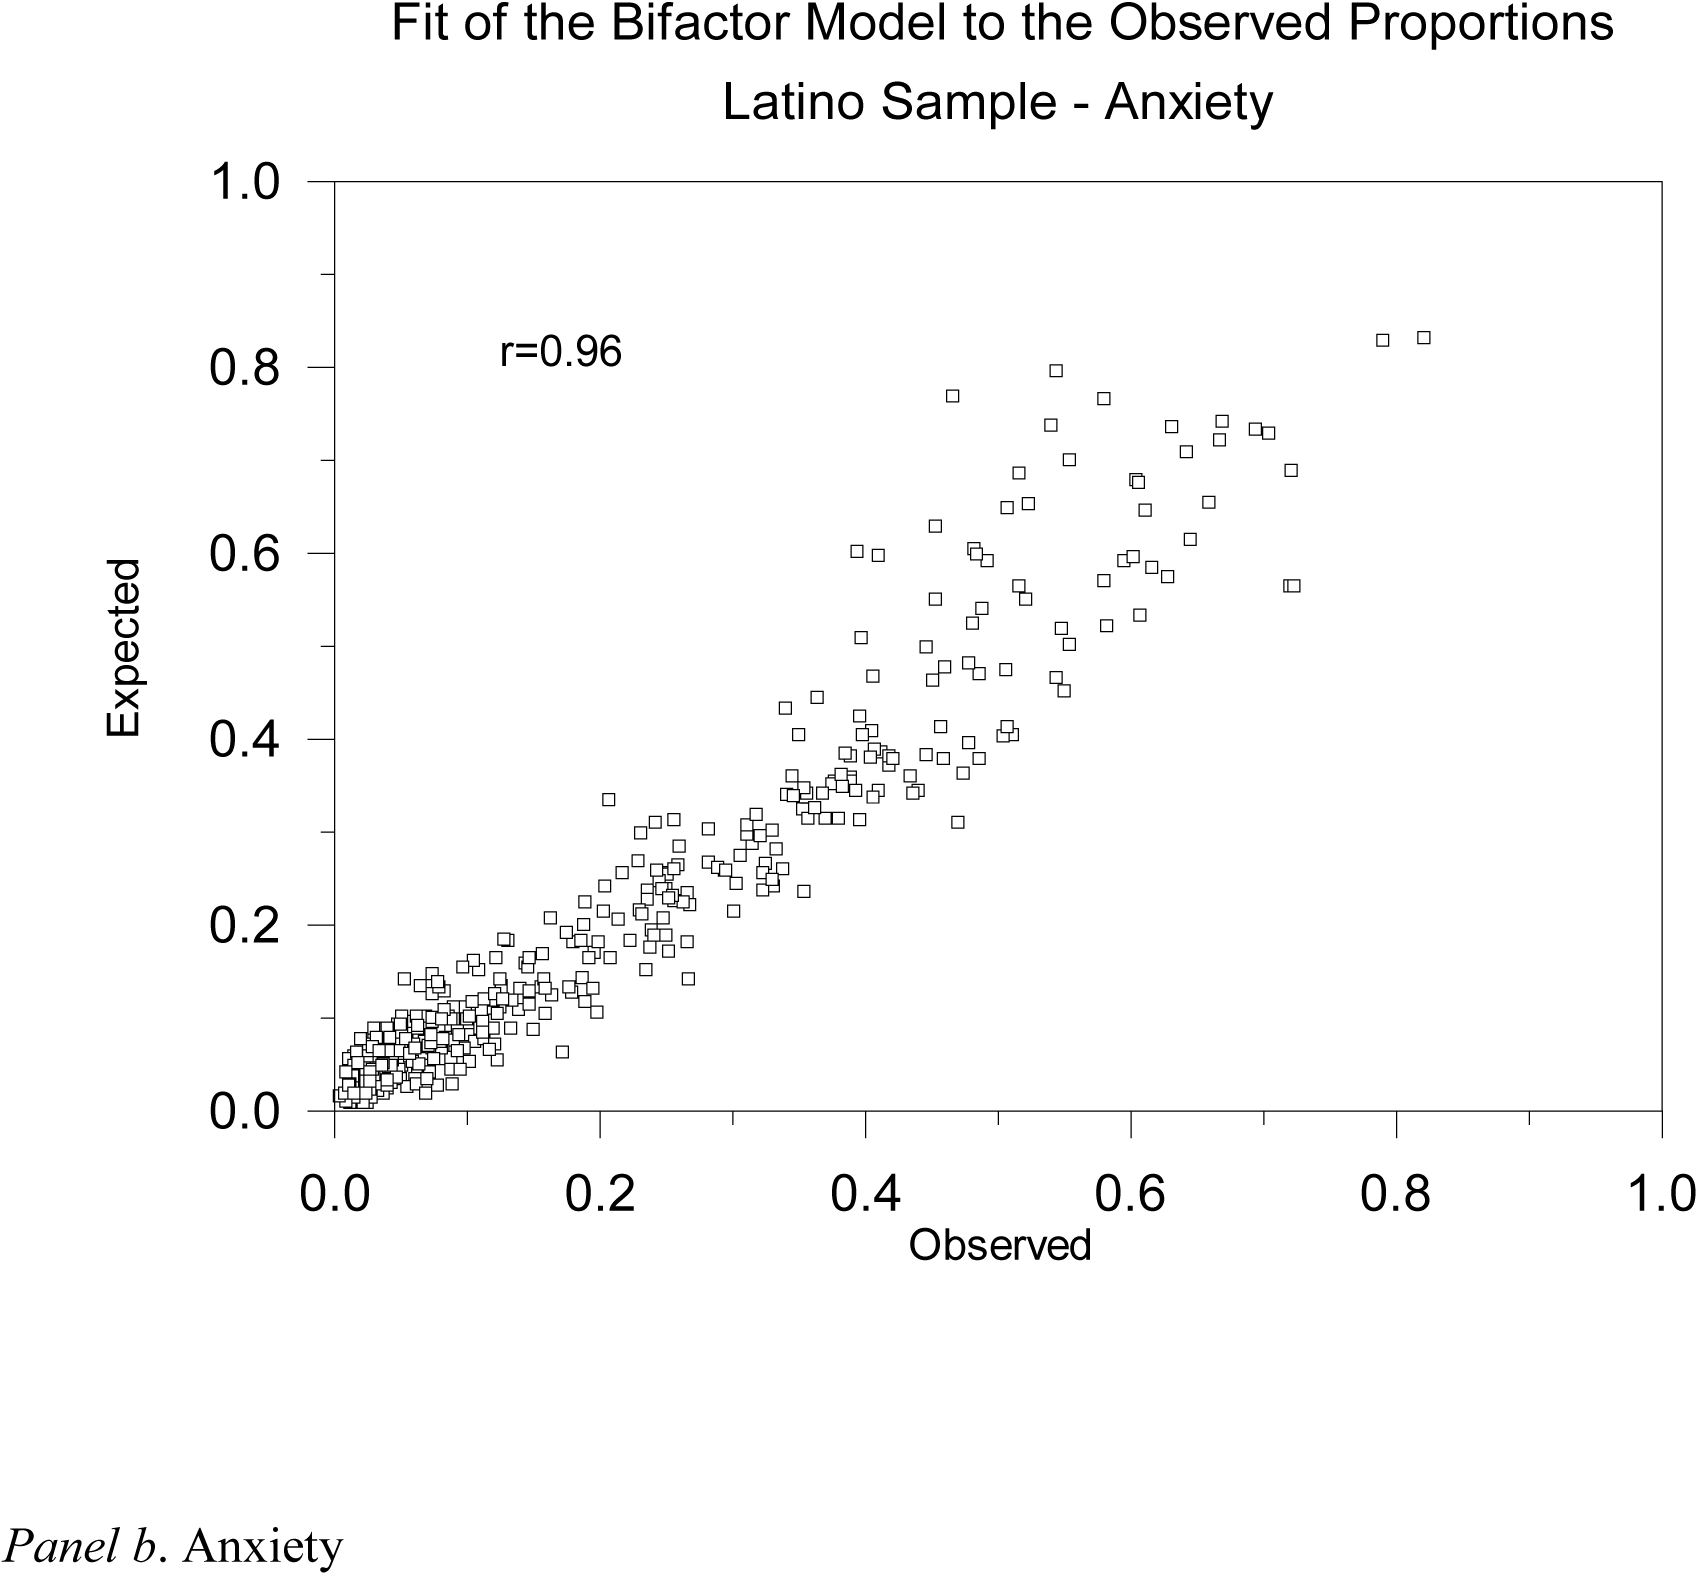
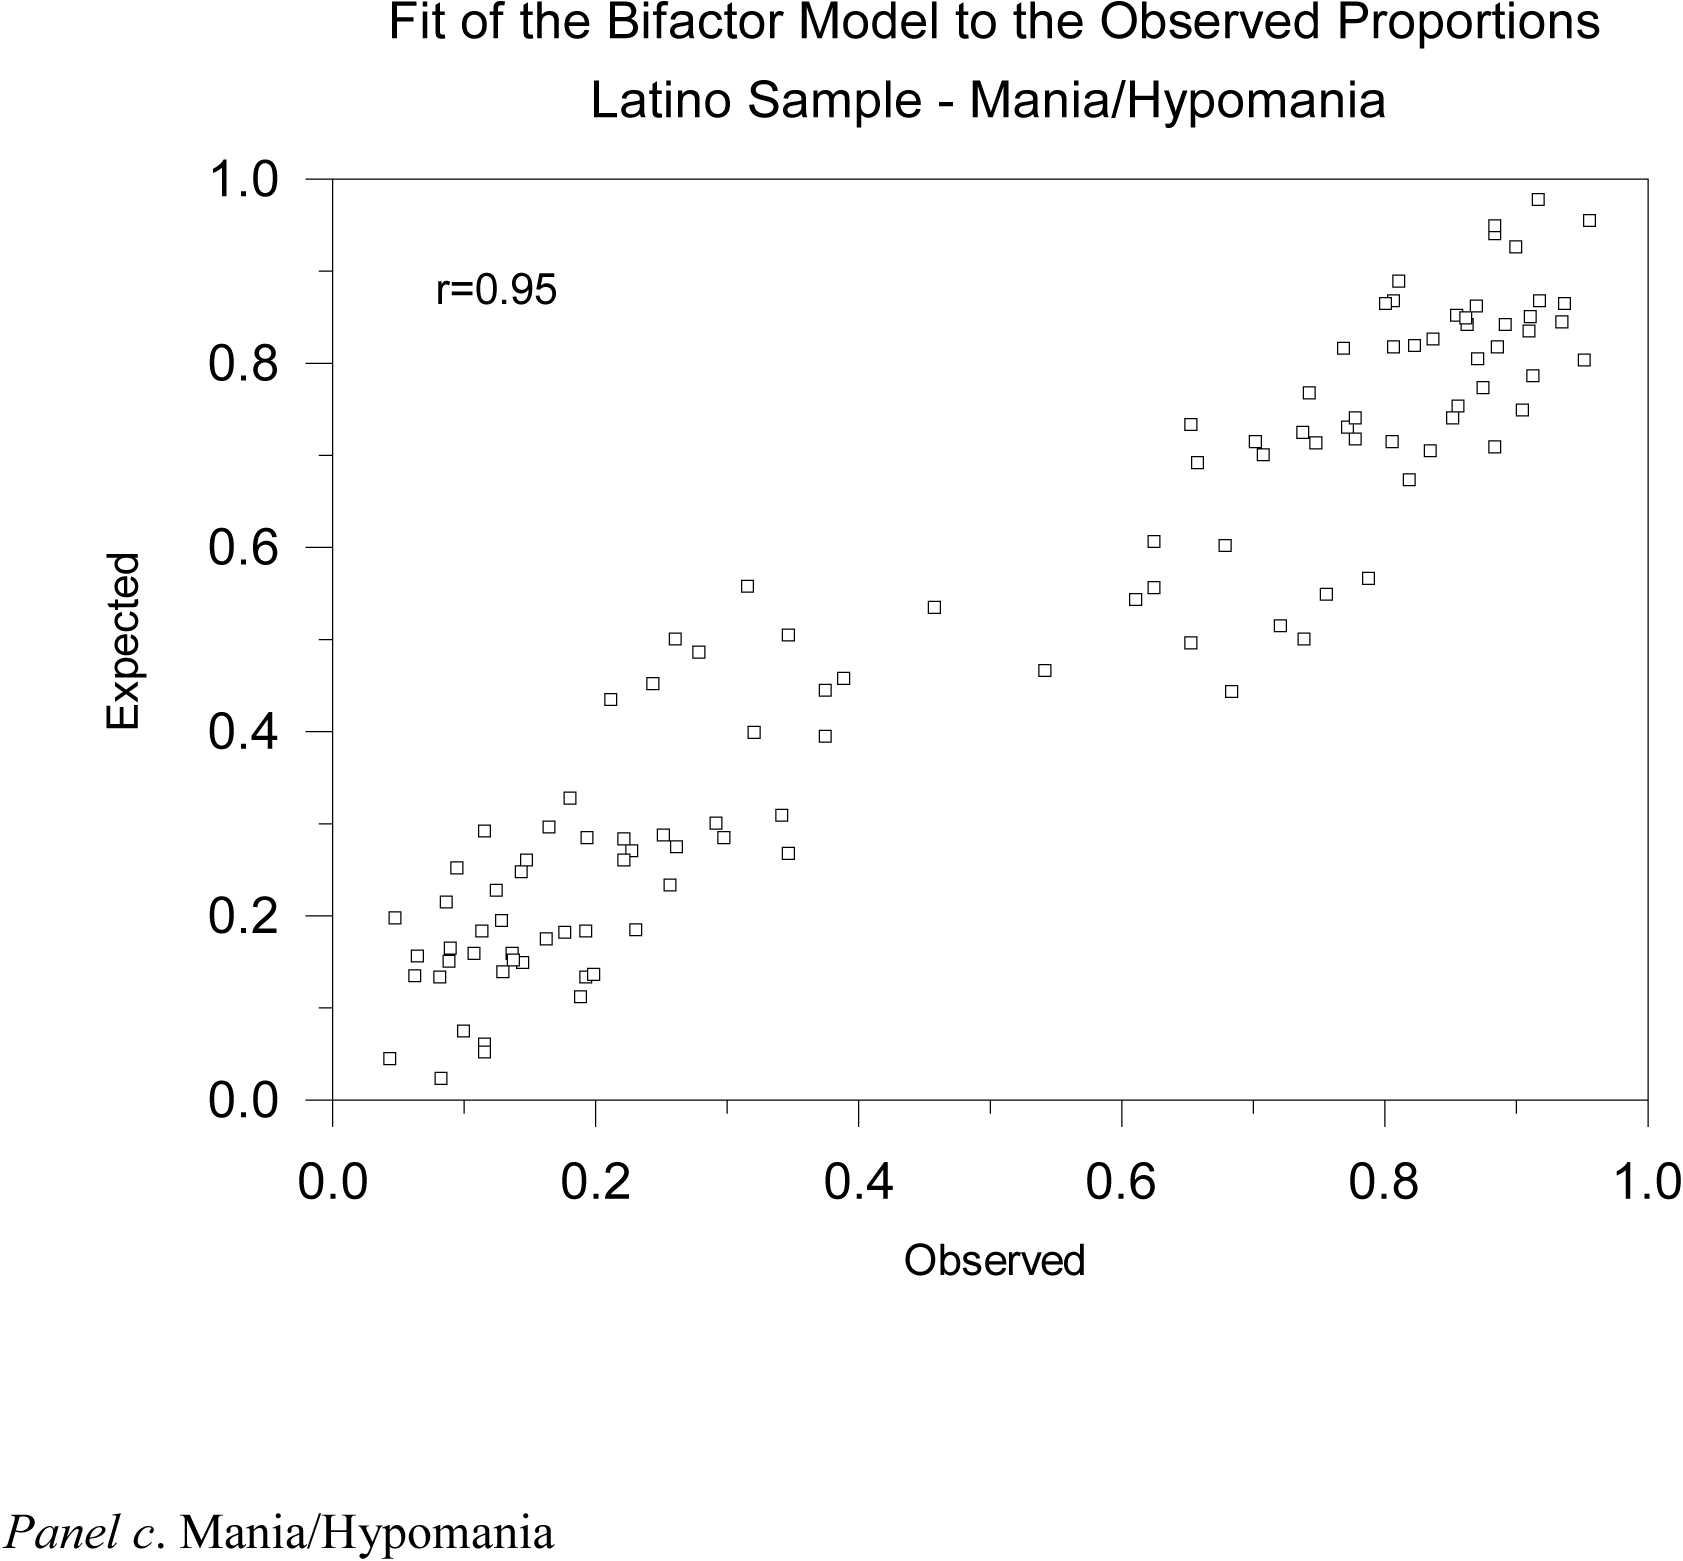
Figure 2.


Model fit. Observed and expected marginal response category proportions based on the bifactor model for the Latino sample data. Panel (a) displays the 377 categories for the 77 depression items most of which had 5 categories. Panel (b) displays the 400 categories for the 84 anxiety items most of which had 5 categories. Panel (c) displays the 110 categories for the 55 mania/hypomania items most of which had 2 categories.
