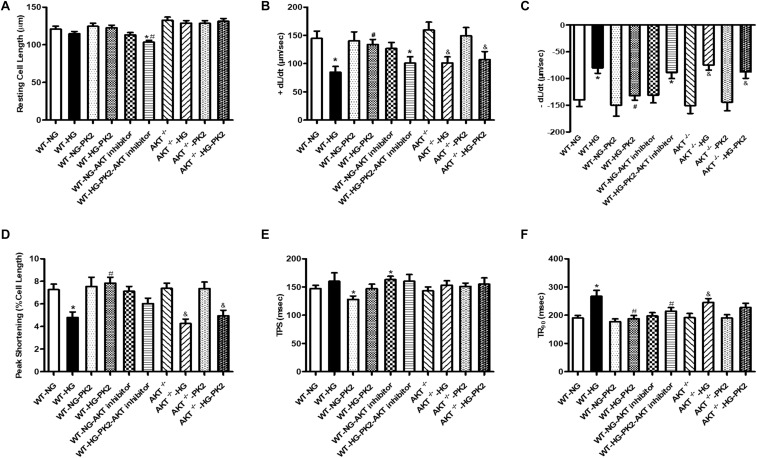
FIGURE 1.
Effect of PK2 on cardiomyocyte shortening. WT, wild-type mouse cardiomyocytes; AKT–/–, AKT-knockout mouse cardiomyocytes; NG, normal glucose; HG, high glucose; NG-PK2, normal glucose plus PK2; HG-PK2, high glucose plus PK2. (A) Resting cell length. (B) +dL/dt. (C) –dL/dt. (D) PS. (E) TPS. (F) TR90. The data are mean ± SEM; * P value less than 0.05 versus the WT-NG; #P value less than 0.05 versus the WT-HG; &P value less than 0.05 versus the AKT–/– group n = 35–75 cells per group.

