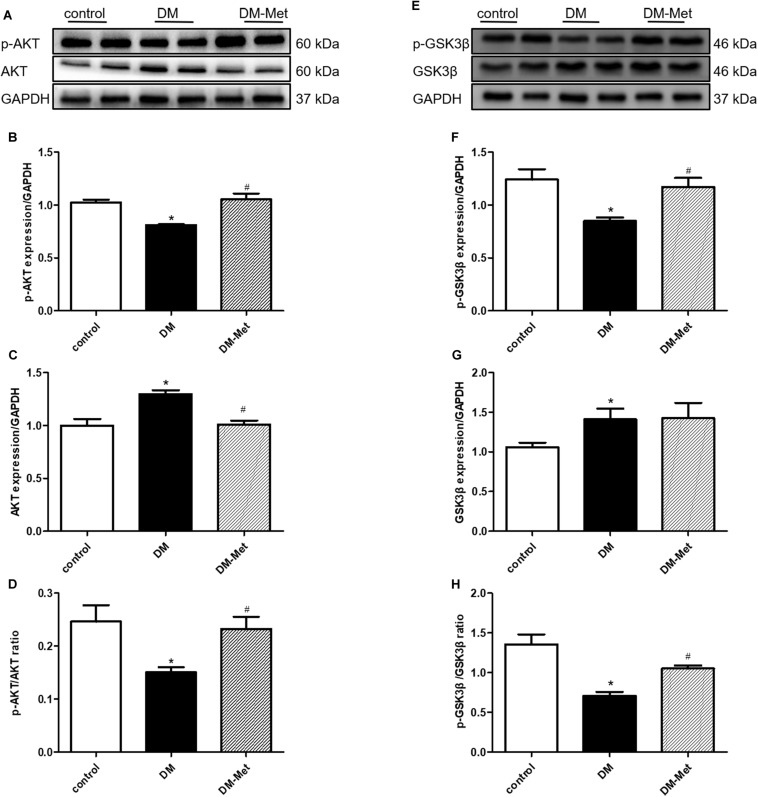
FIGURE 5.
Met activated the AKT/GSK3β signaling pathway in DM mice. (A) Images of p-AKT and AKT protein levels. (B) Analysis of p-AKT. (C) Analysis of AKT. (D) Analysis of the p-AKT/AKT ratio. (E) Images of p-GSK3β and GSK3β protein levels. (F) Analysis of p-GSK3β. (G) Analysis of GSK3β. (H) Analysis of the p-GSK3β/GSK3β ratio. The data are mean ± SEM; * P value less than 0.05 versus the control group; # P value less than 0.05 versus the DM group; n = 4 per group.

