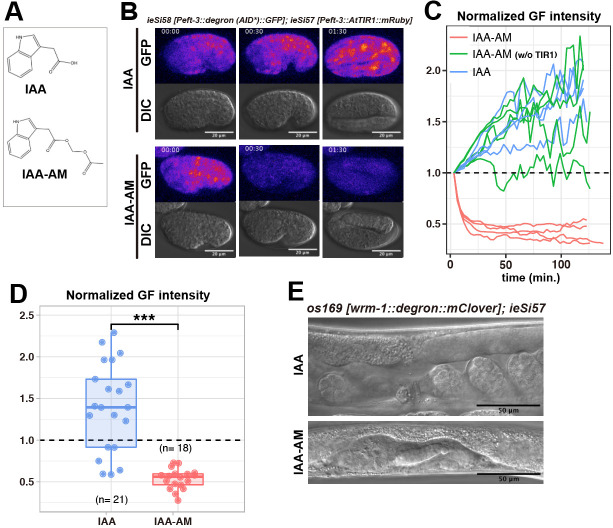
Figure 1.
(A) Chemical structural formula of indole-3-acetic acid (IAA) and acetoxymethyl indole-3-acetic acid (IAA-AM). (B) Frames from time lapse videos of ieSi58 [Peft-3::degron (AID*)::GFP]; ieSi57 [Peft–3::AtTIR1::mRuby] laid embryos in IAA (1 mM) or IAA-AM (1 mM); elapsed time (hours:minutes) from the beginning of recording is indicated. GFP panels show maximum intensity projection images, and green fluorescent signal is colored with “Fire” look-up-table. Scale bar, 20 μm. (C) Plots of green fluorescent (GF) intensity in timelapse observation. Red lines: IAA-AM treatment of ieSi58 ieSi57 embryos, green lines: IAA-AM treatment of ieSi58 embryos (no TIR1 present), blue lines: IAA treatment of ieSi58 ieSi57 embryos. Mean values of GF intensity in eggshells were obtained every three minutes, and normalized by the intensity at 0 min. (D) Comparison of GF depletion between IAA and IAA-AM treatment of ieSi58; ieSi57 embryos. Mean values of GF intensity within eggshells were obtained after each treatment (two hours), and normalized with that of the beginning, *** indicates p < 0.01, p= 1.6 x 10⁻⁸ (Wilcoxon rank sum test). (E) Representative images of os169 ieSi57 adults, which are IAA or IAA-AM treated during embryos development (two hours).

